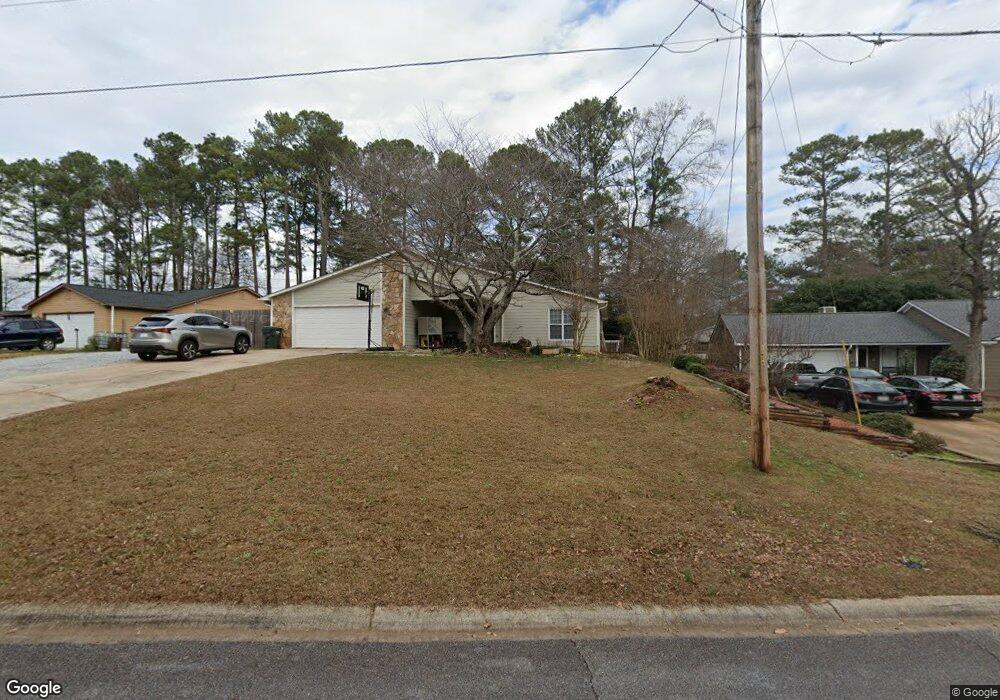
2273 New Castle Cir Unit 1 Norcross, GA 30071
Estimated Value: $325,000 - $378,000
3
Beds
2
Baths
1,788
Sq Ft
$197/Sq Ft
Est. Value
About This Home
This home is located at 2273 New Castle Cir Unit 1, Norcross, GA 30071 and is currently estimated at $351,496, approximately $196 per square foot. 2273 New Castle Cir Unit 1 is a home located in Gwinnett County with nearby schools including Norcross Elementary School, Summerour Middle School, and Norcross High School.
Ownership History
Date
Name
Owned For
Owner Type
Purchase Details
Closed on
Mar 4, 2005
Sold by
Pham Chi V
Bought by
Pham Chi
Current Estimated Value
Home Financials for this Owner
Home Financials are based on the most recent Mortgage that was taken out on this home.
Original Mortgage
$109,250
Outstanding Balance
$54,611
Interest Rate
5.6%
Mortgage Type
New Conventional
Estimated Equity
$296,885
Purchase Details
Closed on
Feb 8, 2005
Sold by
Mers
Bought by
Pham Chi V
Home Financials for this Owner
Home Financials are based on the most recent Mortgage that was taken out on this home.
Original Mortgage
$109,250
Outstanding Balance
$54,611
Interest Rate
5.6%
Mortgage Type
New Conventional
Estimated Equity
$296,885
Purchase Details
Closed on
Oct 5, 2004
Sold by
Donovan William F
Bought by
Mortgage Electronic Registrati
Purchase Details
Closed on
Jun 28, 1996
Sold by
Rossi Marion L
Bought by
Donovan William F
Create a Home Valuation Report for This Property
The Home Valuation Report is an in-depth analysis detailing your home's value as well as a comparison with similar homes in the area
Home Values in the Area
Average Home Value in this Area
Purchase History
| Date | Buyer | Sale Price | Title Company |
|---|---|---|---|
| Pham Chi | -- | -- | |
| Pham Chi V | $115,000 | -- | |
| Mortgage Electronic Registrati | $127,604 | -- | |
| Donovan William F | $92,500 | -- |
Source: Public Records
Mortgage History
| Date | Status | Borrower | Loan Amount |
|---|---|---|---|
| Open | Pham Chi | $109,250 | |
| Closed | Donovan William F | $0 |
Source: Public Records
Tax History Compared to Growth
Tax History
| Year | Tax Paid | Tax Assessment Tax Assessment Total Assessment is a certain percentage of the fair market value that is determined by local assessors to be the total taxable value of land and additions on the property. | Land | Improvement |
|---|---|---|---|---|
| 2025 | -- | $136,040 | $21,600 | $114,440 |
| 2024 | $3,215 | $136,040 | $21,600 | $114,440 |
| 2023 | $3,215 | $136,040 | $21,600 | $114,440 |
| 2022 | $828 | $82,040 | $14,840 | $67,200 |
| 2021 | $2,169 | $82,040 | $14,840 | $67,200 |
| 2020 | $2,190 | $84,240 | $14,840 | $69,400 |
| 2019 | $2,855 | $79,360 | $14,000 | $65,360 |
| 2018 | $1,525 | $51,800 | $10,000 | $41,800 |
| 2016 | $1,527 | $51,800 | $10,000 | $41,800 |
| 2015 | $1,662 | $42,880 | $8,000 | $34,880 |
| 2014 | -- | $42,880 | $8,000 | $34,880 |
Source: Public Records
Map
Nearby Homes
- 2199 Summertown Dr
- 5477 Windy Creek Ln
- 5479 Windy Creek Ln
- 2375 Beaver Falls Dr
- 5364 Hickory Knoll
- 5358 Beaver Branch
- 5357 Beaver Branch
- 5341 Goodwick Way
- 2340 Beaver Ruin Rd Unit 26
- 2340 Beaver Ruin Rd Unit 41
- 2340 Beaver Ruin Rd
- 2340 Beaver Ruin Rd Unit 15
- 2340 Beaver Ruin Rd Unit 16
- 5457 Rails Way
- 26 Reeves St
- 5639 Chatham Cir
- 5381 Station Cir Unit 3
- 2472 Westhill Ct NW
- 2472 Westhill Ct
- 5206 Westhill Dr NW
- 2283 New Castle Cir Unit 1
- 2263 New Castle Cir
- 2272 Huddersfield Way Unit 1
- 2282 Huddersfield Way
- 2253 New Castle Cir Unit 1
- 2262 Huddersfield Way Unit 1
- 2293 New Castle Cir
- 2272 New Castle Cir
- 5464 Doncaster Ct
- 2262 New Castle Cir Unit 1
- 2292 Huddersfield Way
- 2252 Huddersfield Way
- 2292 New Castle Cir
- 2303 New Castle Cir
- 2252 New Castle Cir Unit 1
- 5474 Doncaster Ct Unit 1
- 2302 New Castle Cir Unit 1
- 2243 New Castle Cir
- 2273 Huddersfield Way
- 2242 New Castle Cir