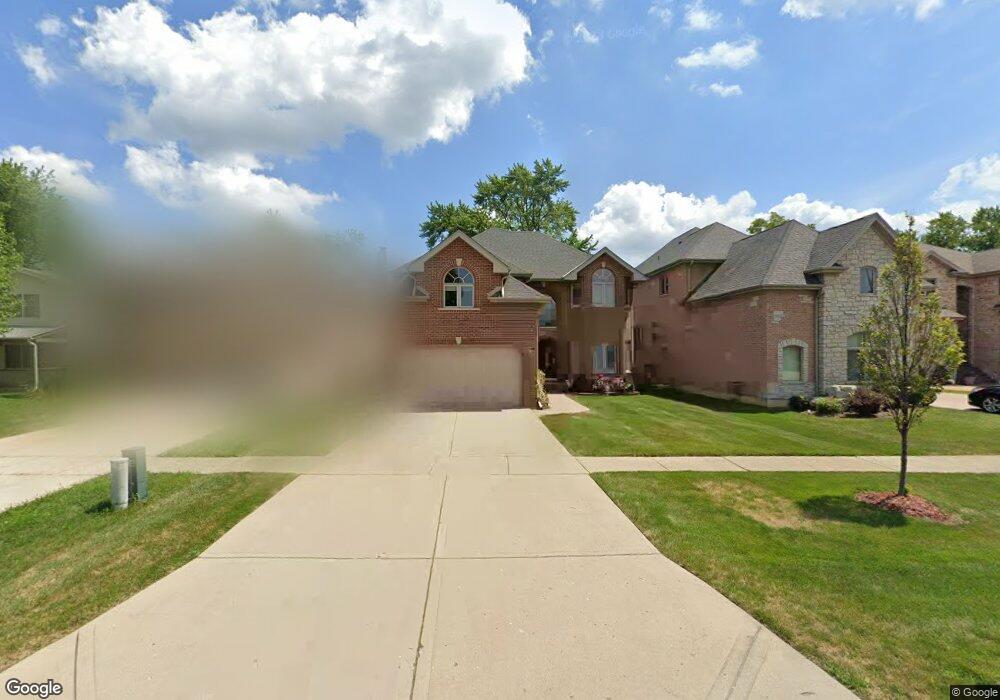
2273 Webster Ln Des Plaines, IL 60018
Estimated Value: $772,963 - $910,000
4
Beds
3
Baths
3,732
Sq Ft
$222/Sq Ft
Est. Value
About This Home
This home is located at 2273 Webster Ln, Des Plaines, IL 60018 and is currently estimated at $829,491, approximately $222 per square foot. 2273 Webster Ln is a home located in Cook County with nearby schools including Plainfield Elementary School, Algonquin Middle School, and Maine West High School.
Ownership History
Date
Name
Owned For
Owner Type
Purchase Details
Closed on
Oct 22, 2008
Sold by
Tcif Reo Gcm Llc
Bought by
Joseph Augustine R and Thomas Saramma
Current Estimated Value
Home Financials for this Owner
Home Financials are based on the most recent Mortgage that was taken out on this home.
Original Mortgage
$375,000
Outstanding Balance
$241,555
Interest Rate
6.04%
Mortgage Type
Unknown
Estimated Equity
$587,936
Purchase Details
Closed on
Jun 12, 2008
Sold by
Al Rifaee Abeer O
Bought by
Tcif Req Gcm Llc
Purchase Details
Closed on
Feb 1, 2006
Sold by
Andrukiewicz Ewa
Bought by
Al Rifaee Abeer O
Home Financials for this Owner
Home Financials are based on the most recent Mortgage that was taken out on this home.
Original Mortgage
$564,000
Interest Rate
6.2%
Mortgage Type
Fannie Mae Freddie Mac
Purchase Details
Closed on
Sep 20, 2000
Sold by
Krukowski Miroslaw and Mikoda Mariusz
Bought by
Andrukiewicz Ewa
Create a Home Valuation Report for This Property
The Home Valuation Report is an in-depth analysis detailing your home's value as well as a comparison with similar homes in the area
Home Values in the Area
Average Home Value in this Area
Purchase History
| Date | Buyer | Sale Price | Title Company |
|---|---|---|---|
| Joseph Augustine R | $520,000 | First American Title | |
| Tcif Req Gcm Llc | -- | None Available | |
| Al Rifaee Abeer O | $705,000 | Multiple | |
| Andrukiewicz Ewa | -- | -- |
Source: Public Records
Mortgage History
| Date | Status | Borrower | Loan Amount |
|---|---|---|---|
| Open | Joseph Augustine R | $375,000 | |
| Previous Owner | Al Rifaee Abeer O | $564,000 |
Source: Public Records
Tax History
| Year | Tax Paid | Tax Assessment Tax Assessment Total Assessment is a certain percentage of the fair market value that is determined by local assessors to be the total taxable value of land and additions on the property. | Land | Improvement |
|---|---|---|---|---|
| 2025 | $14,945 | $76,000 | $11,220 | $64,780 |
| 2024 | $14,945 | $60,000 | $9,350 | $50,650 |
| 2023 | $14,559 | $60,000 | $9,350 | $50,650 |
| 2022 | $14,559 | $60,000 | $9,350 | $50,650 |
| 2021 | $14,317 | $49,906 | $6,077 | $43,829 |
| 2020 | $14,144 | $49,906 | $6,077 | $43,829 |
| 2019 | $14,168 | $56,075 | $6,077 | $49,998 |
| 2018 | $13,718 | $49,305 | $5,376 | $43,929 |
| 2017 | $13,493 | $49,305 | $5,376 | $43,929 |
| 2016 | $13,007 | $49,305 | $5,376 | $43,929 |
| 2015 | $13,114 | $46,002 | $4,675 | $41,327 |
| 2014 | $12,854 | $46,002 | $4,675 | $41,327 |
| 2013 | $12,516 | $46,002 | $4,675 | $41,327 |
Source: Public Records
Map
Nearby Homes
- 2323 Douglas Ave
- 635 Birchwood Ave
- 805 S Tures Ln
- 614 Birchwood Ave
- 1370 Fargo Ave Unit E
- 1738 Lunt Ave
- 1629 E Touhy Ave
- 1641 E Touhy Ave
- 1445 Everett Ave
- 664 E Oakton St
- 1541 Cooper St
- 1080 Bogart St
- 1689 S Elm St
- 1458 Kingston Ct
- 1596 Oxford Rd
- 2646 Maple St
- 1721 Prospect Ave
- 1757 Farwell Ave
- 1645 Illinois St
- 1394 Carol Ln
- 2267 Webster Ln
- 2279 Webster Ln
- 2275 Webster Ln
- 2259 Webster Ln
- 2253 Webster Ln
- 2285 Webster Ln
- 2272 Eastview Dr
- 2264 Eastview Dr
- 2282 Eastview Dr
- 2248 Eastview Dr
- 2247 Webster Ln
- 2264 Webster Ln
- 2274 Webster Ln
- 2246 Eastview Dr
- 2293 Webster Ln
- 2280 Webster Ln
- 2290 Eastview Dr
- 2258 Webster Ln
- 2242 Eastview Dr
- 2284 Webster Ln
Your Personal Tour Guide
Ask me questions while you tour the home.