NOT LISTED FOR SALE

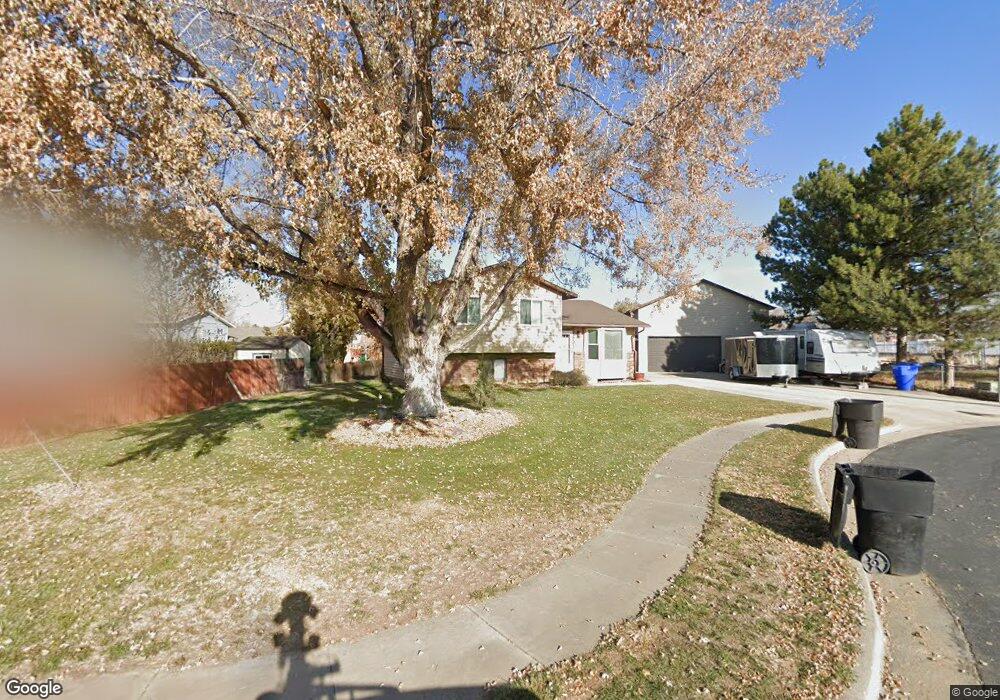
2274 W 670 N Clearfield, UT 84015

Estimated Value: $423,000 - $476,000

3 Beds
1 Bath
1,062 Sq Ft
$426/Sq Ft Est. Value

About This Home

This home is located at 2274 W 670 N, Clearfield, UT 84015 and is currently estimated at $451,897, approximately $425 per square foot. 2274 W 670 N is a home located in Davis County with nearby schools including Lakeside School, West Point Junior High School, and Syracuse High School.

Ownership History

Date Name Owned For Owner Type

Purchase Details

Closed on
Mar 28, 2016
Sold by
Davies Ronald S
Bought by
Davies Ronald S and Davies Lissa
Current Estimated Value
$451,897

Purchase Details

Closed on
Feb 22, 2007
Sold by
Holbrook Judy
Bought by
Showman Joseph A and Showman Robin L

Home Financials for this Owner

Home Financials are based on the most recent Mortgage that was taken out on this home.
Original Mortgage
$138,050
Interest Rate
6.21%
Mortgage Type
FHA

Purchase Details

Closed on
Dec 15, 2005
Sold by
Campbell Debbie A
Bought by
Holbrook Judy

Home Financials for this Owner

Home Financials are based on the most recent Mortgage that was taken out on this home.
Original Mortgage
$102,400
Interest Rate
7.75%
Mortgage Type
Fannie Mae Freddie Mac

Purchase Details

Closed on
Feb 10, 1997
Sold by
Campbell Brian L and Campbell Debbie A
Bought by
Campbell Debbie A

Range of Values:

Collateral Analytics

Collateral Analytics Collateral Analytics AVMs (Automated Valuation Model) employ a number of statistical approaches combined with neighborhood-specific comparable selection guarantees the most up-to-date and precise valuations.

Not Available

Collateral Analytics does not have data for the current month. Please view the chart for historical values.

ICE

ICE Mortgage Technology ICE Mortgage Technology’s AVM (Automated Valuation Model) is a state-of-the-art online residential property valuation tool that provides a quick and accurate estimate of the value of almost any home in the U.S.

Not Available

ICE Mortgage Technology does not have data for the current month. Please view the chart for historical values.

First American

First American First American Data & Analytics’ next-generation AVM combines unrivaled data assets with a blended ensemble of valuation models to produce highly accurate, reliable valuations you can trust.

Not Available

First American does not have data for the current month. Please view the chart for historical values.

Quantarium

Quantarium Quantarium’s valuation service, repeatedly proven the industry’s most accurate and comprehensive, is supercharged with a self-learning and auto-tuning AI engine that continually becomes smarter and more accurate as it processes daily inputs from the industry’s leading RE data lake.

Not Available

Quantarium does not have data for the current month. Please view the chart for historical values.

Average Value
Not Available
List Price
Sold Price
Create a Home Valuation Report for This Property
The Home Valuation Report is an in-depth analysis detailing your home's value as well as a comparison with similar homes in the area

Home Values in the Area

Source: Public Records

Average Home Value in this Area


Source: Public Records

Purchase History

Date Buyer Sale Price Title Company
Davies Ronald S -- Backman Title
Davies Ronald S -- Mountain View Title
Campbell Debbie A -- --
Source: Public Records

Mortgage History

Date Status Borrower Loan Amount
Open Davies Ronald S $177,500
Previous Owner Showman Joseph A $141,421
Previous Owner Showman Joseph A $154,660
Previous Owner Holbrook Judy $102,400
Previous Owner Holbrook Judy $25,600
Source: Public Records

Tax History Compared to Growth

Source: Public Records

Tax History

Year Tax Paid Tax Assessment Tax Assessment Total Assessment is a certain percentage of the fair market value that is determined by local assessors to be the total taxable value of land and additions on the property. Land Improvement
2024 $2,326 $218,900 $110,348 $108,552
2023 $2,096 $363,000 $140,700 $222,300
2022 $2,217 $210,100 $74,082 $136,018
2021 $1,947 $276,000 $112,314 $163,686
2020 $1,701 $238,000 $94,973 $143,027
2019 $1,645 $227,000 $96,555 $130,445
2018 $1,507 $205,000 $95,137 $109,863
2016 $1,298 $92,896 $31,421 $61,475
2015 $1,257 $85,251 $31,421 $53,830
2014 $1,084 $74,534 $31,421 $43,113
2013 -- $76,848 $29,535 $47,313
Source: Public Records

Map