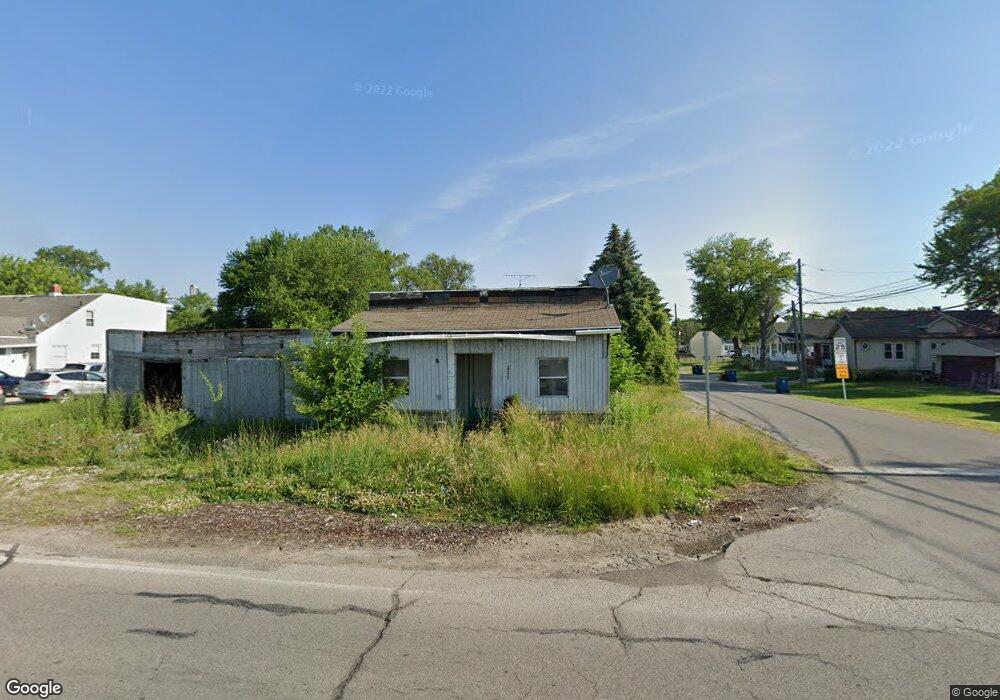
2275 Pickle Rd Oregon, OH 43616
Estimated Value: $140,000
2
Beds
1
Bath
968
Sq Ft
$145/Sq Ft
Est. Value
About This Home
This home is located at 2275 Pickle Rd, Oregon, OH 43616 and is currently priced at $140,000, approximately $144 per square foot. 2275 Pickle Rd is a home located in Lucas County with nearby schools including St. Kateri Catholic Schools and Kateri Catholic Academy.
Ownership History
Date
Name
Owned For
Owner Type
Purchase Details
Closed on
Feb 12, 2025
Sold by
City Of Oregon
Bought by
Rodriguez Peter P
Current Estimated Value
Purchase Details
Closed on
Mar 11, 2024
Sold by
Lucas Cnty Land Reutilization
Bought by
City Of Oregon
Purchase Details
Closed on
Sep 30, 2019
Sold by
Millimen Joshua R
Bought by
Stevenson Andrew M
Purchase Details
Closed on
Dec 4, 2018
Sold by
Urbina Simon
Bought by
Millimen Joshua R
Purchase Details
Closed on
Nov 13, 2015
Sold by
Meeks Michael W and Meeks Pamela Jo
Bought by
Urbina Simon
Purchase Details
Closed on
Dec 9, 2013
Sold by
Meeks David J
Bought by
Meeks Michael W and Meeks Pamela Jo
Purchase Details
Closed on
Aug 27, 1993
Sold by
Brown John E and Brown Kelly J
Create a Home Valuation Report for This Property
The Home Valuation Report is an in-depth analysis detailing your home's value as well as a comparison with similar homes in the area
Home Values in the Area
Average Home Value in this Area
Purchase History
| Date | Buyer | Sale Price | Title Company |
|---|---|---|---|
| Rodriguez Peter P | -- | None Listed On Document | |
| City Of Oregon | -- | None Listed On Document | |
| Stevenson Andrew M | $300 | None Available | |
| Millimen Joshua R | -- | None Available | |
| Urbina Simon | $10,000 | None Available | |
| Meeks Michael W | $25,000 | None Available | |
| -- | -- | -- |
Source: Public Records
Tax History
| Year | Tax Paid | Tax Assessment Tax Assessment Total Assessment is a certain percentage of the fair market value that is determined by local assessors to be the total taxable value of land and additions on the property. | Land | Improvement |
|---|---|---|---|---|
| 2025 | -- | $560 | $560 | -- |
| 2024 | -- | $17,815 | $5,390 | $12,425 |
| 2023 | $1,341 | $12,460 | $5,460 | $7,000 |
| 2022 | $1,895 | $21,560 | $5,460 | $16,100 |
| 2021 | $1,500 | $21,560 | $5,460 | $16,100 |
| 2020 | $1,156 | $17,640 | $4,445 | $13,195 |
| 2019 | $1,351 | $17,640 | $4,445 | $13,195 |
| 2018 | $1,065 | $17,640 | $4,445 | $13,195 |
| 2017 | $3,534 | $14,595 | $3,500 | $11,095 |
| 2016 | $2,167 | $41,700 | $10,000 | $31,700 |
| 2015 | $982 | $41,700 | $10,000 | $31,700 |
| 2014 | $873 | $14,320 | $3,430 | $10,890 |
| 2013 | $873 | $14,320 | $3,430 | $10,890 |
Source: Public Records
Map
Nearby Homes
- 2249 Pickle Rd
- 674 Sylvandale Ave
- 2011 Oakdale Ave
- 2074 Price St
- 2121 Nevada St
- 1532 Liberty St
- 1531 Freedom St
- 577 Dover Place
- 2649 Luverne Ave
- 1940 Hurd St
- 1508 Albert St
- 1512 Vinal St
- 509 Dover Place
- 1401 Liberty St
- 1413 Ironwood Ave
- 558 Thurston St
- 1705 Idaho St
- 1230 Hirzel St
- 1043 Lakeside Ln
- 755 Dearborn Ave
- 2265 Pickle Rd
- 1146 Cresceus Rd
- 2301 Pickle Rd
- 1149 Cresceus Rd
- 1140 Cresceus Rd
- 2307 Pickle Rd
- 1147 Cresceus Rd
- 1134 Cresceus Rd
- 2311 Pickle Rd
- 1147 Patchen Rd
- 1145 Cresceus Rd
- 1132 Cresceus Rd
- 2317 Pickle Rd
- 1143 Patchen Rd
- 1126 Cresceus Rd
- 1137 Cresceus Rd
- 1146 Mambrino Rd
- 1127 Cresceus Rd
- 2327 Pickle Rd
- 1142 Mambrino Rd
Your Personal Tour Guide
Ask me questions while you tour the home.