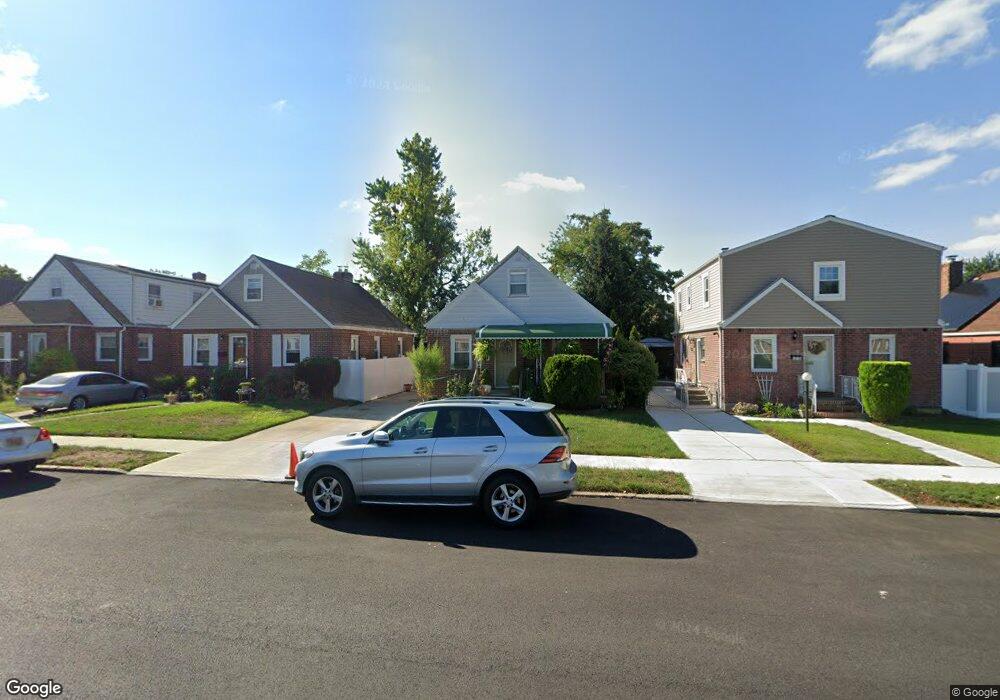
22758 114th Rd Cambria Heights, NY 11411
Cambria Heights NeighborhoodEstimated Value: $591,974 - $708,000
--
Bed
--
Bath
1,031
Sq Ft
$632/Sq Ft
Est. Value
About This Home
This home is located at 22758 114th Rd, Cambria Heights, NY 11411 and is currently estimated at $651,244, approximately $631 per square foot. 22758 114th Rd is a home located in Queens County with nearby schools including P.S./M.S. 147 Ronald Mcnair, I.S. 192 The Linden, and Cambria Center For The Gifted Child.
Ownership History
Date
Name
Owned For
Owner Type
Purchase Details
Closed on
Feb 9, 2005
Sold by
Parks Audrey and Parks Lennox
Bought by
Parks Audrey
Current Estimated Value
Purchase Details
Closed on
Feb 22, 2002
Sold by
Millennium 3000 Realty
Bought by
Parks Audrey and Parks Lennox
Home Financials for this Owner
Home Financials are based on the most recent Mortgage that was taken out on this home.
Original Mortgage
$264,900
Outstanding Balance
$107,018
Interest Rate
6.88%
Estimated Equity
$544,226
Purchase Details
Closed on
Aug 27, 2001
Sold by
Crawford Cynthia and Crawford Thomas
Bought by
Millennium 3000 Realty
Purchase Details
Closed on
Feb 27, 1996
Sold by
Crawford Cynthia and Martin Josie
Bought by
Crawford Cynthia and Crawford Thomas
Purchase Details
Closed on
Mar 1, 1995
Sold by
Miller Jeannine
Bought by
Crawford Cynthia and Martin Josie
Home Financials for this Owner
Home Financials are based on the most recent Mortgage that was taken out on this home.
Original Mortgage
$124,800
Interest Rate
8.8%
Create a Home Valuation Report for This Property
The Home Valuation Report is an in-depth analysis detailing your home's value as well as a comparison with similar homes in the area
Home Values in the Area
Average Home Value in this Area
Purchase History
| Date | Buyer | Sale Price | Title Company |
|---|---|---|---|
| Parks Audrey | -- | -- | |
| Parks Audrey | -- | -- | |
| Parks Audrey | -- | -- | |
| Parks Audrey V | -- | -- | |
| Millennium 3000 Realty | -- | -- | |
| Millennium 3000 Realty | -- | -- | |
| Crawford Cynthia | -- | First American Title Ins Co | |
| Crawford Cynthia | -- | First American Title Ins Co | |
| Crawford Cynthia | $156,000 | First American Title Ins Co |
Source: Public Records
Mortgage History
| Date | Status | Borrower | Loan Amount |
|---|---|---|---|
| Open | Parks Audrey V | $264,900 | |
| Closed | Parks Audrey V | $264,900 | |
| Previous Owner | Crawford Cynthia | $124,800 | |
| Previous Owner | Crawford Cynthia | $0 |
Source: Public Records
Tax History Compared to Growth
Tax History
| Year | Tax Paid | Tax Assessment Tax Assessment Total Assessment is a certain percentage of the fair market value that is determined by local assessors to be the total taxable value of land and additions on the property. | Land | Improvement |
|---|---|---|---|---|
| 2025 | $4,804 | $26,837 | $7,609 | $19,228 |
| 2024 | $4,816 | $25,319 | $7,245 | $18,074 |
| 2023 | $4,516 | $23,886 | $6,954 | $16,932 |
| 2022 | $4,481 | $36,180 | $11,040 | $25,140 |
| 2021 | $4,693 | $37,500 | $11,040 | $26,460 |
| 2020 | $4,438 | $34,920 | $11,040 | $23,880 |
| 2019 | $4,121 | $32,220 | $11,040 | $21,180 |
| 2018 | $3,760 | $19,905 | $7,694 | $12,211 |
| 2017 | $3,758 | $19,905 | $8,557 | $11,348 |
| 2016 | $3,639 | $19,905 | $8,557 | $11,348 |
| 2015 | $2,045 | $18,637 | $10,590 | $8,047 |
| 2014 | $2,045 | $17,583 | $10,367 | $7,216 |
Source: Public Records
Map
Nearby Homes
- 440 Parkway Dr
- 2334 Belmont Ave
- 22554 Murdock Ave
- 225-53 Murdock Ave
- 22524 Murdock Ave
- 22734 112th Rd
- 22533 Murdock Ave
- 114-109 228th St
- 22726 112th Rd
- 114-67 226th St
- 225-23 Murdock Ave
- 219 Locustwood Blvd
- 22343 113th Dr
- 11480 226th St
- 174 Wellington Rd
- 224-06 114th Rd
- 22722 112th Ave
- 114-66 225th St
- 165 Heathcote Rd
- 22324 Murdock Ave