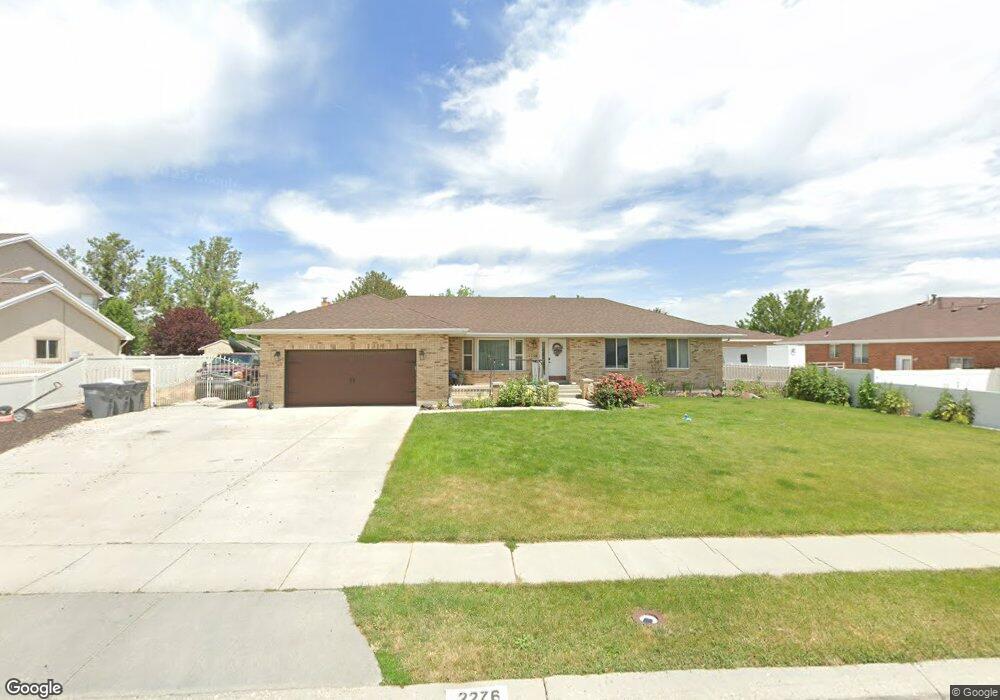
2276 Hobbs Dr South Jordan, UT 84095
Estimated Value: $728,000 - $798,000
6
Beds
4
Baths
3,486
Sq Ft
$219/Sq Ft
Est. Value
About This Home
This home is located at 2276 Hobbs Dr, South Jordan, UT 84095 and is currently estimated at $763,629, approximately $219 per square foot. 2276 Hobbs Dr is a home located in Salt Lake County with nearby schools including Jordan Ridge School, South Jordan Middle School, and Hawthorn Academy.
Ownership History
Date
Name
Owned For
Owner Type
Purchase Details
Closed on
Nov 21, 2019
Sold by
Gross Paffiela and Hennessy Pamela C
Bought by
Hennessy Pamela C
Current Estimated Value
Home Financials for this Owner
Home Financials are based on the most recent Mortgage that was taken out on this home.
Original Mortgage
$337,500
Outstanding Balance
$226,755
Interest Rate
3.5%
Estimated Equity
$536,874
Purchase Details
Closed on
Jun 6, 2016
Sold by
Mason Kenneth W
Bought by
Gross Pamela
Home Financials for this Owner
Home Financials are based on the most recent Mortgage that was taken out on this home.
Original Mortgage
$272,300
Interest Rate
3.66%
Mortgage Type
New Conventional
Purchase Details
Closed on
Nov 14, 2014
Sold by
Mason Kenneth and Mason Connie
Bought by
Mason Kenneth W
Purchase Details
Closed on
Aug 24, 2004
Sold by
Mason Kenneth
Bought by
Mason Kenneth and Mason Connie
Purchase Details
Closed on
Jun 26, 2002
Sold by
Adams Douglas and Adams Pamela D
Bought by
Mason Kenneth
Create a Home Valuation Report for This Property
The Home Valuation Report is an in-depth analysis detailing your home's value as well as a comparison with similar homes in the area
Home Values in the Area
Average Home Value in this Area
Purchase History
| Date | Buyer | Sale Price | Title Company |
|---|---|---|---|
| Hennessy Pamela C | -- | First American Title | |
| Gross Pamela | -- | Meridian Title | |
| Mason Kenneth W | -- | None Available | |
| Mason Kenneth | -- | -- | |
| Mason Kenneth | -- | First American Title |
Source: Public Records
Mortgage History
| Date | Status | Borrower | Loan Amount |
|---|---|---|---|
| Open | Hennessy Pamela C | $337,500 | |
| Previous Owner | Gross Pamela | $272,300 |
Source: Public Records
Tax History Compared to Growth
Tax History
| Year | Tax Paid | Tax Assessment Tax Assessment Total Assessment is a certain percentage of the fair market value that is determined by local assessors to be the total taxable value of land and additions on the property. | Land | Improvement |
|---|---|---|---|---|
| 2025 | $3,418 | $691,800 | $309,100 | $382,700 |
| 2024 | $3,418 | $648,900 | $289,000 | $359,900 |
| 2023 | $3,418 | $621,800 | $283,300 | $338,500 |
| 2022 | $3,632 | $637,800 | $277,800 | $360,000 |
| 2021 | $3,031 | $488,300 | $227,800 | $260,500 |
| 2020 | $2,848 | $430,100 | $213,300 | $216,800 |
| 2019 | $2,753 | $408,600 | $213,300 | $195,300 |
| 2018 | $2,588 | $382,300 | $138,200 | $244,100 |
| 2017 | $2,482 | $359,200 | $138,200 | $221,000 |
| 2016 | $2,477 | $339,700 | $138,200 | $201,500 |
| 2015 | $2,535 | $338,100 | $151,400 | $186,700 |
| 2014 | $2,376 | $311,400 | $140,900 | $170,500 |
Source: Public Records
Map
Nearby Homes
- 2097 Jordan Villa Dr
- 9414 S 1980 W
- 9496 S 1930 W
- 2116 W Abbey View Rd
- 2177 W 9240 S
- 2246 Country Bend Dr Unit 25
- 9252 S 2040 W Unit D
- 2223 W Williamsburg Cir
- 1968 W 9270 S Unit C
- 2286 Williamsburg Cir
- 1753 Rylie Ann Cir
- 1967 W 9350 S
- 9178 Lisa Ave
- 2551 W Winding Way
- 9294 S 2700 W
- 1788 W Ikaros Ln
- 9511 S Tirado Cove Unit 204
- Brook Haven Plan at Jordan Woods
- Maple Plan at Jordan Woods
- The Maple Basement Plan at Jordan Woods
- 2296 Hobbs Dr
- 2256 W Hobbs Dr
- 2256 Hobbs Dr
- 2291 Hobbs Dr
- 2236 W Hobbs Dr
- 2236 Hobbs Dr
- 9541 S 2200 W
- 2265 W Hobbs Dr
- 2265 Hobbs Dr
- 9523 S Hunter Bend Ct Unit 2
- 2322 W Hobbs Dr
- 2322 Hobbs Dr
- 2249 Hobbs Dr
- 9605 Providence Way
- 9605 S Providence Way
- 2216 Hobbs Dr
- 2218 W Hunter Bend Ct Unit 2
- 2324 Hobbs Dr
- 2218 W Hunter Bend Ct Unit 1
- 2229 W Hobbs Dr