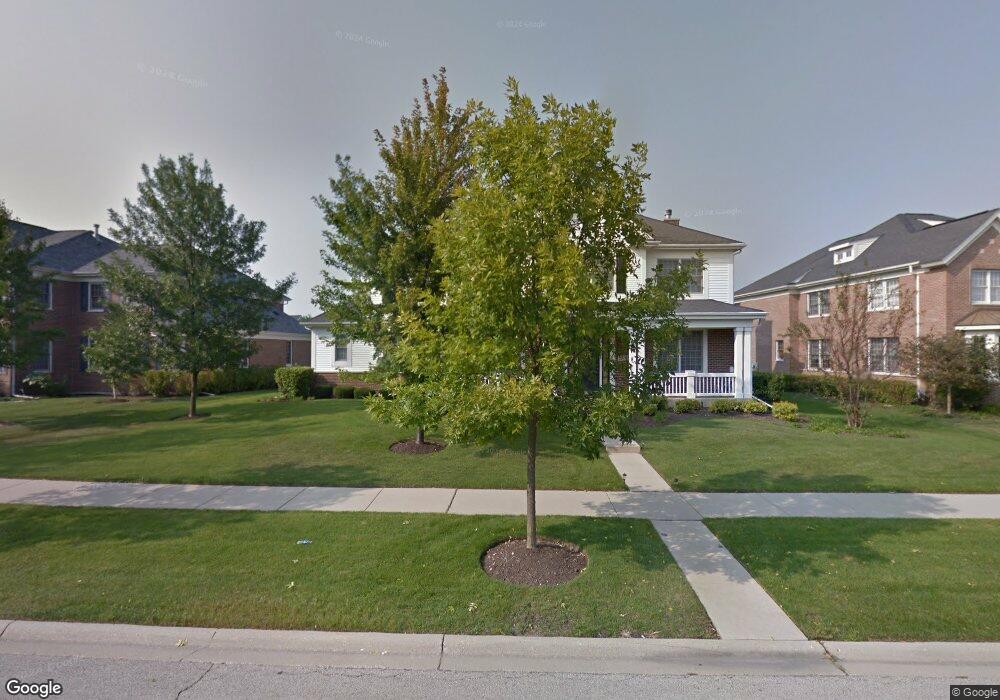
2276 Thistle Rd Glenview, IL 60026
The Glen NeighborhoodEstimated Value: $1,482,000 - $1,716,000
5
Beds
5
Baths
4,000
Sq Ft
$394/Sq Ft
Est. Value
About This Home
This home is located at 2276 Thistle Rd, Glenview, IL 60026 and is currently estimated at $1,575,345, approximately $393 per square foot. 2276 Thistle Rd is a home located in Cook County with nearby schools including Westbrook Elementary School, Glen Grove Elementary School, and Attea Middle School.
Ownership History
Date
Name
Owned For
Owner Type
Purchase Details
Closed on
Jul 16, 2019
Sold by
Zheng Bingyue and Zhao Ellen
Bought by
Zheng Bingyue and Zhao Ellen
Current Estimated Value
Purchase Details
Closed on
Jun 5, 2008
Sold by
Mohanty Devi and Chandra Rashmi
Bought by
Zhao Ellen and Zheng Bingyue
Home Financials for this Owner
Home Financials are based on the most recent Mortgage that was taken out on this home.
Original Mortgage
$417,000
Interest Rate
6.09%
Mortgage Type
Unknown
Purchase Details
Closed on
May 1, 2003
Sold by
Concord At The Glen Llc
Bought by
Mohanty Devi and Chandra Rashmi
Home Financials for this Owner
Home Financials are based on the most recent Mortgage that was taken out on this home.
Original Mortgage
$644,600
Interest Rate
5.9%
Mortgage Type
Unknown
Create a Home Valuation Report for This Property
The Home Valuation Report is an in-depth analysis detailing your home's value as well as a comparison with similar homes in the area
Home Values in the Area
Average Home Value in this Area
Purchase History
| Date | Buyer | Sale Price | Title Company |
|---|---|---|---|
| Zheng Bingyue | -- | Attorney | |
| Zhao Ellen | $880,000 | Multiple | |
| Mohanty Devi | $806,000 | Chicago Title Insurance Comp | |
| Mohanty Devi | $806,000 | Chicago Title Insurance Comp |
Source: Public Records
Mortgage History
| Date | Status | Borrower | Loan Amount |
|---|---|---|---|
| Previous Owner | Zhao Ellen | $417,000 | |
| Previous Owner | Mohanty Devi | $644,600 | |
| Closed | Mohanty Devi | $80,600 |
Source: Public Records
Tax History
| Year | Tax Paid | Tax Assessment Tax Assessment Total Assessment is a certain percentage of the fair market value that is determined by local assessors to be the total taxable value of land and additions on the property. | Land | Improvement |
|---|---|---|---|---|
| 2025 | $23,613 | $138,000 | $29,527 | $108,473 |
| 2024 | $23,613 | $110,001 | $25,023 | $84,978 |
| 2023 | $22,925 | $110,001 | $25,023 | $84,978 |
| 2022 | $22,925 | $110,001 | $25,023 | $84,978 |
| 2021 | $23,045 | $95,920 | $12,010 | $83,910 |
| 2020 | $22,828 | $95,920 | $12,010 | $83,910 |
| 2019 | $21,271 | $105,407 | $12,010 | $93,397 |
| 2018 | $22,605 | $101,722 | $10,509 | $91,213 |
| 2017 | $22,016 | $101,722 | $10,509 | $91,213 |
| 2016 | $20,989 | $101,722 | $10,509 | $91,213 |
| 2015 | $19,147 | $83,027 | $8,507 | $74,520 |
| 2014 | $18,809 | $83,027 | $8,507 | $74,520 |
| 2013 | $18,222 | $83,027 | $8,507 | $74,520 |
Source: Public Records
Map
Nearby Homes
- 2132 Rugen Rd Unit E
- 1619 Patriot Blvd
- 2020 Chestnut Ave Unit 312
- 2000 Chestnut Ave Unit 103
- 2000 Chestnut Ave Unit 407
- 1813 Admiral Ct Unit 118
- 2701 Commons Dr Unit 210
- 1855 Tanglewood Dr Unit F
- 1809 Jefferson Ave
- 2238 Prairie St
- 1220 Depot St Unit 305
- 2710 Langley Cir Unit 201003
- 1410 Pebblecreek Dr Unit 153
- 1774 Rogers Ave
- 1088 Shermer Rd Unit DW
- 2254 Thistle Rd
- 2298 Thistle Rd
- 1667 Primrose Ln
- 2232 Thistle Rd
- 2222 Thistle Rd
- 2267 Daisy Ave Unit 1
- 2277 Thistle Rd
- 1699 Primrose Ln
- 2255 Thistle Rd
- 2299 Thistle Rd
- 2233 Daisy Ave
- 2200 Thistle Rd
- 2223 Thistle Rd
- 1660 Primrose Ln
- 1650 Primrose Ln
- 1670 Primrose Ln
- 1599 Cottonwood Dr
- 1598 Cottonwood Dr
- 2201 Thistle Rd Unit 1
- 1680 Primrose Ln
Your Personal Tour Guide
Ask me questions while you tour the home.