Estimated Value: $407,000 - $444,000
4
Beds
2
Baths
1,900
Sq Ft
$222/Sq Ft
Est. Value
About This Home
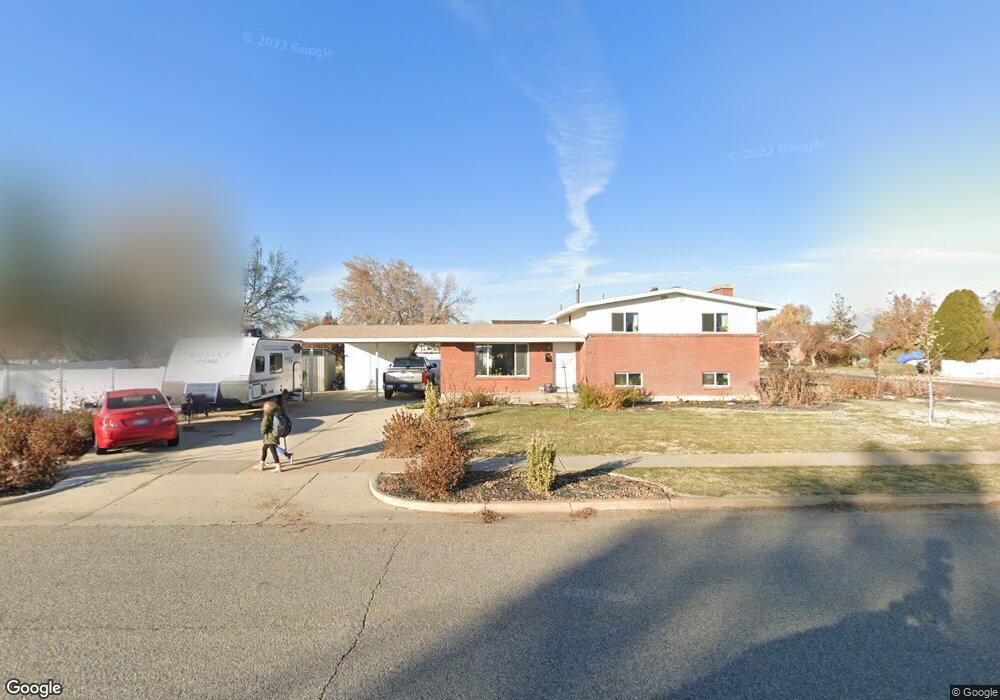
This home is located at 2276 W 4975 S, Roy, UT 84067 and is currently estimated at $421,737, approximately $221 per square foot. 2276 W 4975 S is a home located in Weber County with nearby schools including Lakeview Elementary School, Roy Junior High School, and Roy High School.
Ownership History
Date
Name
Owned For
Owner Type
Purchase Details
Closed on
Nov 16, 2021
Sold by
Hunter Gillins
Bought by
Gillins Hunter
Current Estimated Value
Home Financials for this Owner
Home Financials are based on the most recent Mortgage that was taken out on this home.
Original Mortgage
$269,000
Outstanding Balance
$246,492
Interest Rate
2.99%
Mortgage Type
New Conventional
Estimated Equity
$175,245
Purchase Details
Closed on
Nov 26, 2019
Sold by
Bk Stevens Investments Inc
Bought by
Gillins Hunter
Home Financials for this Owner
Home Financials are based on the most recent Mortgage that was taken out on this home.
Original Mortgage
$239,000
Interest Rate
3.5%
Mortgage Type
New Conventional
Purchase Details
Closed on
Sep 5, 2019
Sold by
Linares Deanna and Linares Charles Mary
Bought by
Stevens Investments Inc and Helpful Home Buyers Llc
Create a Home Valuation Report for This Property
The Home Valuation Report is an in-depth analysis detailing your home's value as well as a comparison with similar homes in the area
Home Values in the Area
Average Home Value in this Area
Purchase History
| Date | Buyer | Sale Price | Title Company |
|---|---|---|---|
| Gillins Hunter | -- | Gt Title Services | |
| Gillins Hunter | -- | Backman Ntp | |
| Gillins Hunter | -- | Backman Ntp | |
| Stevens Investments Inc | -- | Title Guarantee |
Source: Public Records
Mortgage History
| Date | Status | Borrower | Loan Amount |
|---|---|---|---|
| Open | Gillins Hunter | $269,000 | |
| Previous Owner | Gillins Hunter | $239,000 |
Source: Public Records
Tax History Compared to Growth
Tax History
| Year | Tax Paid | Tax Assessment Tax Assessment Total Assessment is a certain percentage of the fair market value that is determined by local assessors to be the total taxable value of land and additions on the property. | Land | Improvement |
|---|---|---|---|---|
| 2025 | $2,486 | $389,317 | $128,515 | $260,802 |
| 2024 | $2,366 | $204,599 | $70,683 | $133,916 |
| 2023 | $2,280 | $197,450 | $66,653 | $130,797 |
| 2022 | $2,521 | $227,150 | $60,611 | $166,539 |
| 2021 | $1,902 | $278,000 | $73,729 | $204,271 |
| 2020 | $1,814 | $244,000 | $73,729 | $170,271 |
| 2019 | $1,621 | $203,000 | $43,199 | $159,801 |
| 2018 | $1,464 | $171,000 | $39,930 | $131,070 |
| 2017 | $1,360 | $148,000 | $39,930 | $108,070 |
| 2016 | $1,326 | $77,689 | $19,926 | $57,763 |
| 2015 | $1,218 | $72,718 | $19,926 | $52,792 |
| 2014 | $1,160 | $68,015 | $17,039 | $50,976 |
Source: Public Records
Map
Nearby Homes