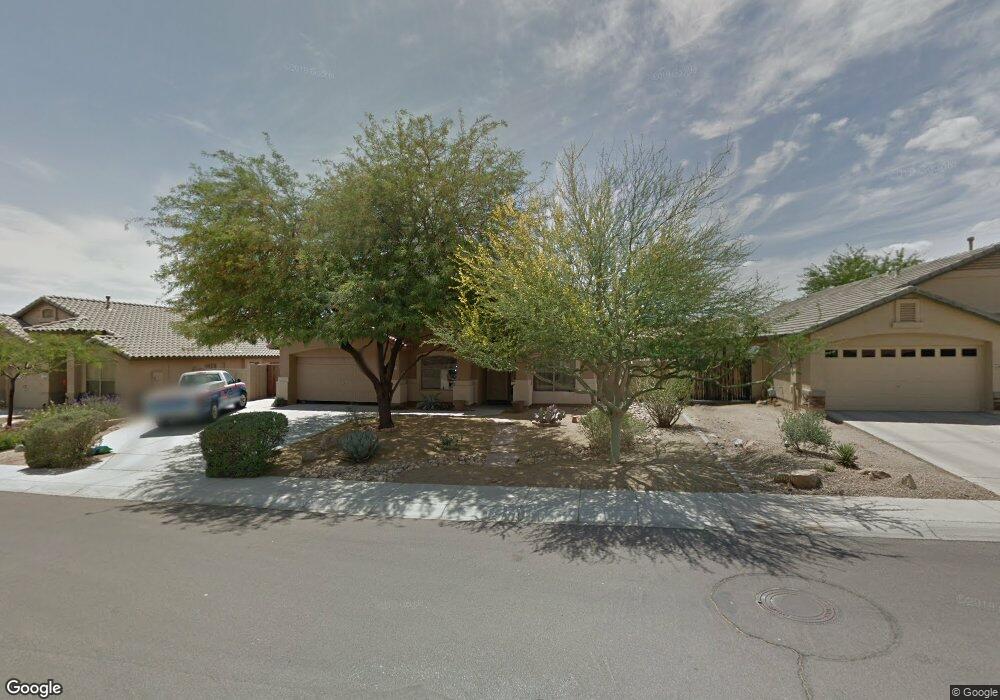
22768 N 104th Ln Peoria, AZ 85383
Estimated Value: $503,255 - $567,000
4
Beds
2
Baths
2,313
Sq Ft
$235/Sq Ft
Est. Value
About This Home
This home is located at 22768 N 104th Ln, Peoria, AZ 85383 and is currently estimated at $544,314, approximately $235 per square foot. 22768 N 104th Ln is a home located in Maricopa County with nearby schools including Sunset Heights Elementary School, Liberty High School, and Candeo Peoria.
Ownership History
Date
Name
Owned For
Owner Type
Purchase Details
Closed on
Mar 2, 2010
Sold by
The Bank Of New York Mellon
Bought by
Ingram John P and Ingram Susan Joan
Current Estimated Value
Home Financials for this Owner
Home Financials are based on the most recent Mortgage that was taken out on this home.
Original Mortgage
$181,649
Interest Rate
5.5%
Mortgage Type
FHA
Purchase Details
Closed on
Jan 8, 2010
Sold by
Flores Abraham and Flores Dawn M
Bought by
The Bank Of New York Mellon and The Bank Of New York
Home Financials for this Owner
Home Financials are based on the most recent Mortgage that was taken out on this home.
Original Mortgage
$181,649
Interest Rate
5.5%
Mortgage Type
FHA
Purchase Details
Closed on
Nov 21, 2000
Sold by
Continental Homes Inc
Bought by
Flores Abraham and Flores Dawn M
Home Financials for this Owner
Home Financials are based on the most recent Mortgage that was taken out on this home.
Original Mortgage
$172,434
Interest Rate
7.86%
Mortgage Type
New Conventional
Create a Home Valuation Report for This Property
The Home Valuation Report is an in-depth analysis detailing your home's value as well as a comparison with similar homes in the area
Home Values in the Area
Average Home Value in this Area
Purchase History
| Date | Buyer | Sale Price | Title Company |
|---|---|---|---|
| Ingram John P | $185,000 | First American Title Ins Co | |
| The Bank Of New York Mellon | $186,750 | First American Title | |
| Flores Abraham | $181,510 | Century Title Agency Inc | |
| Continental Homes Inc | -- | Century Title Agency Inc |
Source: Public Records
Mortgage History
| Date | Status | Borrower | Loan Amount |
|---|---|---|---|
| Previous Owner | Ingram John P | $181,649 | |
| Previous Owner | Flores Abraham | $172,434 |
Source: Public Records
Tax History Compared to Growth
Tax History
| Year | Tax Paid | Tax Assessment Tax Assessment Total Assessment is a certain percentage of the fair market value that is determined by local assessors to be the total taxable value of land and additions on the property. | Land | Improvement |
|---|---|---|---|---|
| 2025 | $2,121 | $26,283 | -- | -- |
| 2024 | $2,079 | $25,031 | -- | -- |
| 2023 | $2,079 | $36,000 | $7,200 | $28,800 |
| 2022 | $2,034 | $27,620 | $5,520 | $22,100 |
| 2021 | $2,172 | $25,530 | $5,100 | $20,430 |
| 2020 | $2,194 | $25,170 | $5,030 | $20,140 |
| 2019 | $2,127 | $22,750 | $4,550 | $18,200 |
| 2018 | $2,036 | $21,220 | $4,240 | $16,980 |
| 2017 | $2,041 | $19,810 | $3,960 | $15,850 |
| 2016 | $1,963 | $18,600 | $3,720 | $14,880 |
| 2015 | $1,884 | $16,770 | $3,350 | $13,420 |
Source: Public Records
Map
Nearby Homes
- 22729 N 103rd Ln
- 22488 N 104th Ln
- 10423 W Navigator Ln
- 10446 W Navigator Ln
- 10226 W Country Club Trail
- 10252 W Villa Chula
- 10459 W Pinnacle Peak Rd Unit 29
- 10328 W Carlota Ln
- 10302 W Pinnacle Peak Rd
- 10456 W Los Gatos Dr
- 00000 W Westwind Dr Unit 201-08-428
- 10370 W Sands Dr Unit 463
- 10296 W Sands Dr Unit 485
- 10172 W Carlota Ln
- 10033 W Jessie Ln
- 10505 W Avenida Del Sol
- 10004 W Sugar Sand Ln
- 22556 N 100th Ave
- 9978 W Sugar Sand Ln
- 22173 N 101st Dr
- 22758 N 104th Ln
- 22804 N 104th Ln
- 23013 N 105th Dr
- 23023 N 105th Dr
- 22814 N 104th Ln
- 22748 N 104th Ln
- 23003 N 105th Dr
- 22767 N 104th Ln
- 23033 N 105th Dr Unit 4
- 10414 W Daley Ln
- 22824 N 104th Ln
- 22833 N 105th Dr
- 23053 N 105th Dr
- 10512 W Patrick Ln
- 10413 W Patrick Ln
- 10511 W Jessie Ln
- 22834 N 104th Ln
- 22823 N 105th Dr
- 23063 N 105th Dr
- 10406 W Daley Ln