
2277 Rector Creek Rd Thompsonville, IL 62890
Estimated payment $4,440/month
About This Home
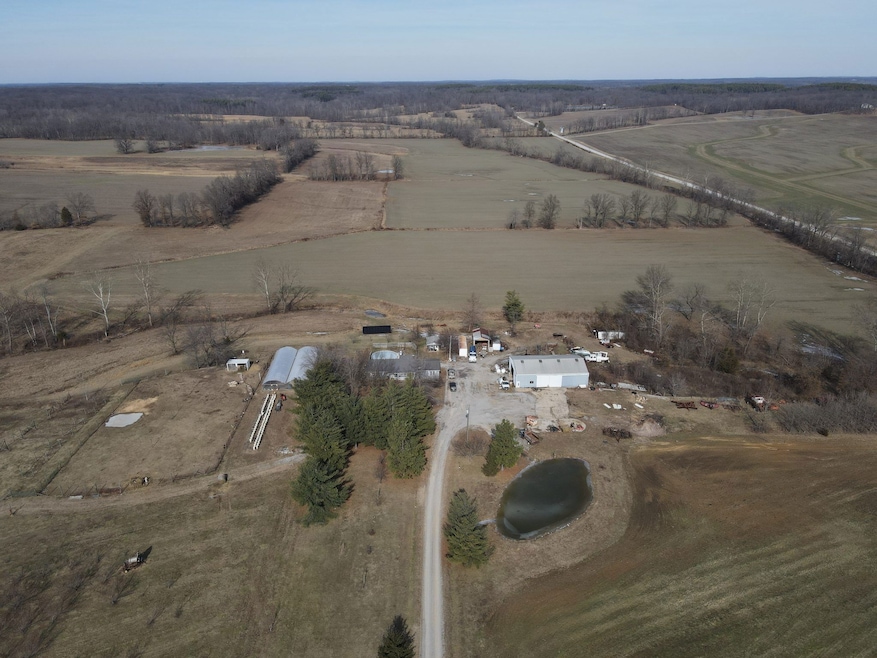
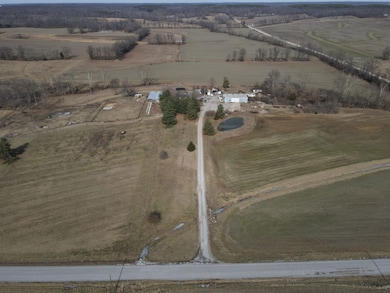
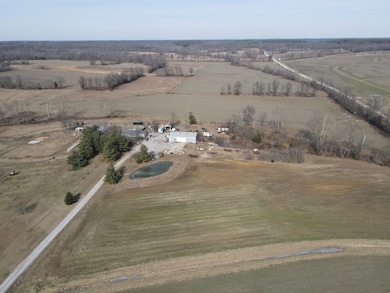
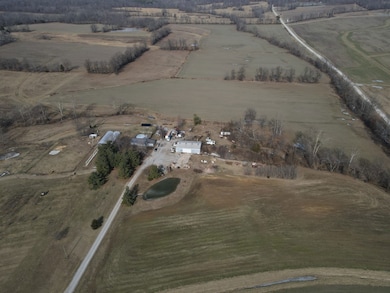
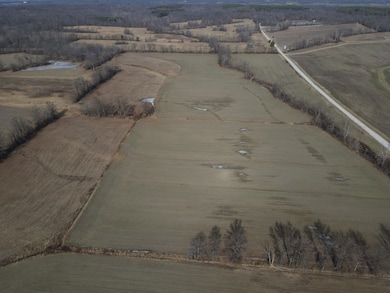
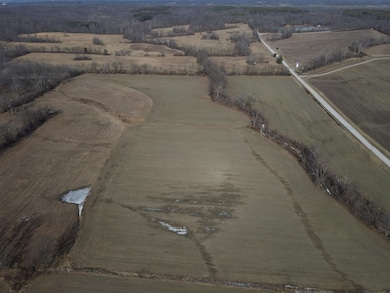
Welcome to this peaceful, country home nestled on 95+/- acres of mostly tillable land. With a great soil PI of 105 and rich Belknap silt loam, this land offers fantastic agricultural potential. The property features a 3-bedroom, 1-bath home with some updated appliances, newer roof, furnace, and water heater. This home has a huge 26×26 master bedroom along with a 26×26 unfinished basement that creates some nice storage.
A 42×70 shed provides ample storage space for equipment or projects, making it ideal for farmers or hobbyists alike. Whether you’re looking to farm, raise some livestock, or simply enjoy the serene countryside, this property offers the perfect balance of comfort and functionality.
This is the perfect starter property for a young farmer. Don’t miss out on this opportunity to own your own piece of Hamilton County.
Listing Agent
Corey Sandshafer
Midwest Farm & Land Co. Listed on: 01/30/2025

Home Details
Home Type
- Single Family
Est. Annual Taxes
- $1,925
Lot Details
- Current uses include row crop
Bedrooms and Bathrooms
- 3 Bedrooms
- 1 Full Bathroom
Map
Home Values in the Area
Average Home Value in this Area
Tax History
| Year | Tax Paid | Tax Assessment Tax Assessment Total Assessment is a certain percentage of the fair market value that is determined by local assessors to be the total taxable value of land and additions on the property. | Land | Improvement |
|---|---|---|---|---|
| 2024 | $1,925 | $40,501 | $5,401 | $35,100 |
| 2023 | $1,925 | $41,212 | $5,110 | $36,102 |
| 2022 | $1,958 | $36,343 | $4,603 | $31,740 |
| 2021 | $1,916 | $34,799 | $4,199 | $30,600 |
| 2020 | $1,985 | $32,450 | $3,521 | $28,929 |
| 2019 | $1,982 | $32,220 | $3,291 | $28,929 |
| 2018 | $2,024 | $26,220 | $3,291 | $22,929 |
| 2017 | $2,074 | $26,009 | $3,080 | $22,929 |
| 2015 | $2,009 | $25,899 | $2,795 | $23,104 |
| 2014 | $1,914 | $30,859 | $2,714 | $28,145 |
| 2013 | -- | $29,918 | $2,534 | $27,384 |
| 2012 | -- | $25,887 | $2,189 | $23,698 |
Property History
| Date | Event | Price | Change | Sq Ft Price |
|---|---|---|---|---|
| 01/29/2025 01/29/25 | For Sale | $775,000 | -- | $413 / Sq Ft |
Purchase History
| Date | Type | Sale Price | Title Company |
|---|---|---|---|
| Deed | -- | -- |
Mortgage History
| Date | Status | Loan Amount | Loan Type |
|---|---|---|---|
| Open | $137,139 | New Conventional |
- 22545 Thompsonville Lake Rd
- 0000 Akin Rd
- 8913 Winemiller Rd
- 22194 Black St
- 2317 Miller Rd
- 22003 Akin Blacktop
- 8271 Pigg Ln
- 0000 Bolen Store Rd
- 0 County Road 750 N Unit RMAEB457700
- 20321 N Shore Ln
- 0000 Campbell's Corner Rd
- 0 Clark Rd Unit Lot WP001
- 19193 Braggs Ln
- 24278 Fisher Ln
- 10 Womack Rd
- 0000 Antioch Rd
- 305 E Church St
- 211 E Lincoln St
- 409 E Church St
- 312 S Mckinley St
- 1921 Grandioso Dr
- 1921 Grandioso Dr
- 1921 Grandioso Dr
- 1921 Grandioso Dr
- 1300 W Boulevard St
- 1004 W Main St Unit SUITE
- 2112 Melanie Ln Unit ApartmentD
- 901 W Cherry St
- 17 Orchard Dr Unit 1
- 6 Ct C
- 2707 Fairway Dr
- 11546 Hurricane Rd
- 701 Eagle Pass Dr
- 100 Timber Trail Dr
- 3419 Westmont St
- 3415-4001 S Water Tower Place