Estimated Value: $508,000 - $597,847
--
Bed
4
Baths
1,548
Sq Ft
$348/Sq Ft
Est. Value
About This Home
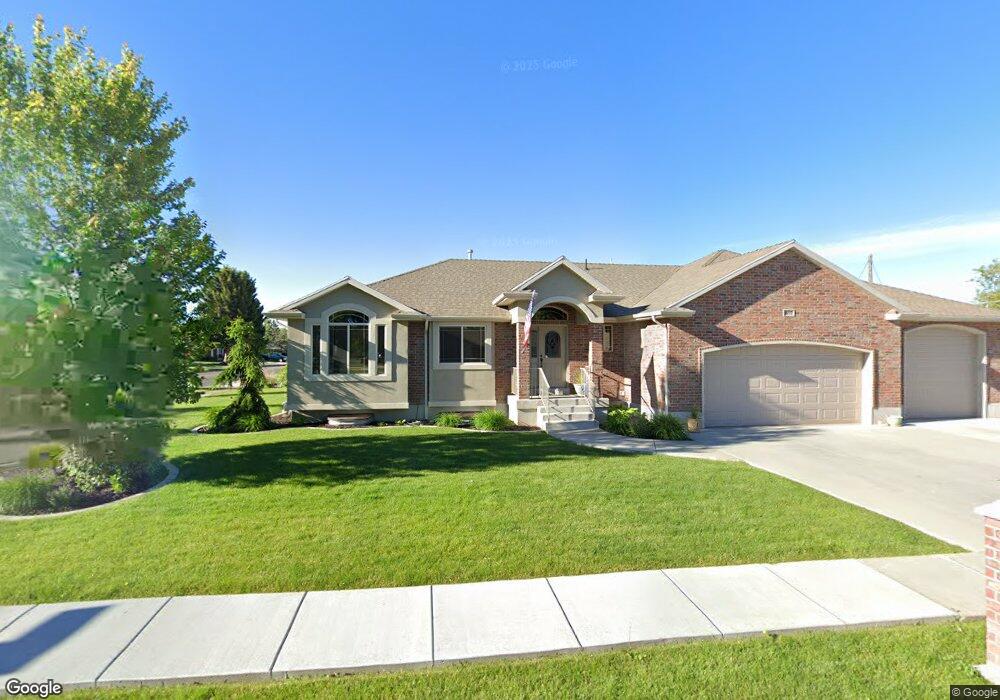
This home is located at 2277 W 4900 S, Roy, UT 84067 and is currently estimated at $539,212, approximately $348 per square foot. 2277 W 4900 S is a home with nearby schools including Lakeview Elementary School, Roy Junior High School, and Roy High School.
Ownership History
Date
Name
Owned For
Owner Type
Purchase Details
Closed on
Apr 2, 2012
Sold by
Wilson Paul Dale
Bought by
Vanwill Properties Llc
Current Estimated Value
Home Financials for this Owner
Home Financials are based on the most recent Mortgage that was taken out on this home.
Original Mortgage
$130,140
Outstanding Balance
$89,549
Interest Rate
3.83%
Mortgage Type
New Conventional
Estimated Equity
$449,663
Purchase Details
Closed on
Nov 18, 2011
Sold by
Wilson Paul D
Bought by
Vanwill Properties Llc
Purchase Details
Closed on
Jun 20, 2006
Sold by
Wilson Tandy J and Wilson Paul D
Bought by
Wilson Paul D
Purchase Details
Closed on
Jun 9, 2006
Sold by
Budge Allen N and Budge Glen L
Bought by
Wilson Tandy J and Wilson Paul D
Create a Home Valuation Report for This Property
The Home Valuation Report is an in-depth analysis detailing your home's value as well as a comparison with similar homes in the area
Home Values in the Area
Average Home Value in this Area
Purchase History
| Date | Buyer | Sale Price | Title Company |
|---|---|---|---|
| Vanwill Properties Llc | -- | Mountain View Title Ogden | |
| Wilson Paul Dale | -- | None Available | |
| Vanwill Properties Llc | -- | None Available | |
| Wilson Paul D | -- | Accommodation | |
| Wilson Tandy J | -- | None Available |
Source: Public Records
Mortgage History
| Date | Status | Borrower | Loan Amount |
|---|---|---|---|
| Open | Wilson Paul Dale | $130,140 |
Source: Public Records
Tax History Compared to Growth
Tax History
| Year | Tax Paid | Tax Assessment Tax Assessment Total Assessment is a certain percentage of the fair market value that is determined by local assessors to be the total taxable value of land and additions on the property. | Land | Improvement |
|---|---|---|---|---|
| 2025 | $3,633 | $591,760 | $128,515 | $463,245 |
| 2024 | $3,430 | $561,000 | $128,516 | $432,484 |
| 2023 | $3,005 | $488,000 | $121,188 | $366,812 |
| 2022 | $3,624 | $613,000 | $110,201 | $502,799 |
| 2021 | $2,785 | $424,000 | $73,729 | $350,271 |
| 2020 | $2,514 | $350,000 | $73,729 | $276,271 |
| 2019 | $2,600 | $343,000 | $43,199 | $299,801 |
| 2018 | $2,411 | $299,000 | $39,930 | $259,070 |
| 2017 | $2,302 | $268,000 | $39,930 | $228,070 |
| 2016 | $2,269 | $142,474 | $19,926 | $122,548 |
| 2015 | $1,971 | $125,987 | $19,926 | $106,061 |
| 2014 | $1,989 | $125,987 | $17,039 | $108,948 |
Source: Public Records
Map
Nearby Homes