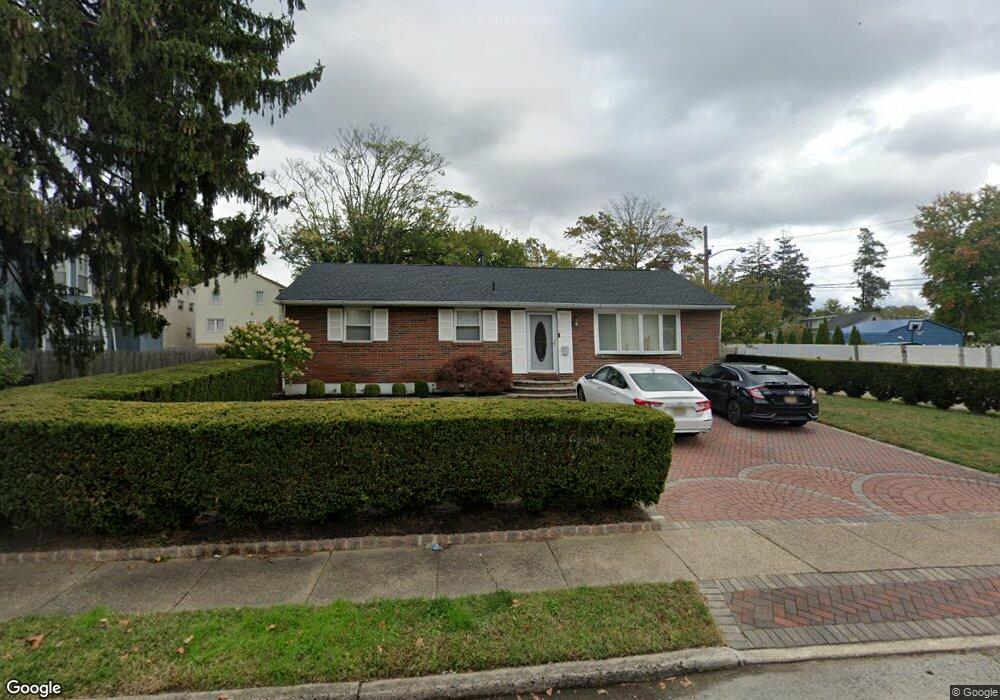
2278 40th St Pennsauken, NJ 08110
Estimated Value: $241,830 - $306,000
--
Bed
--
Bath
1,150
Sq Ft
$238/Sq Ft
Est. Value
About This Home
This home is located at 2278 40th St, Pennsauken, NJ 08110 and is currently estimated at $273,708, approximately $238 per square foot. 2278 40th St is a home located in Camden County with nearby schools including Pennsauken High School, Camden Forward School, and St. Cecilia School.
Ownership History
Date
Name
Owned For
Owner Type
Purchase Details
Closed on
Nov 22, 2017
Sold by
Sosa Valaentin
Bought by
Torres Maria Ascona
Current Estimated Value
Purchase Details
Closed on
Dec 7, 1999
Sold by
Filpo Pascual A
Bought by
Sosa Valentin
Home Financials for this Owner
Home Financials are based on the most recent Mortgage that was taken out on this home.
Original Mortgage
$70,419
Interest Rate
7.81%
Mortgage Type
FHA
Create a Home Valuation Report for This Property
The Home Valuation Report is an in-depth analysis detailing your home's value as well as a comparison with similar homes in the area
Home Values in the Area
Average Home Value in this Area
Purchase History
| Date | Buyer | Sale Price | Title Company |
|---|---|---|---|
| Torres Maria Ascona | -- | Fidelity National Title | |
| Sosa Valentin | $71,000 | -- |
Source: Public Records
Mortgage History
| Date | Status | Borrower | Loan Amount |
|---|---|---|---|
| Previous Owner | Sosa Valentin | $70,419 |
Source: Public Records
Tax History Compared to Growth
Tax History
| Year | Tax Paid | Tax Assessment Tax Assessment Total Assessment is a certain percentage of the fair market value that is determined by local assessors to be the total taxable value of land and additions on the property. | Land | Improvement |
|---|---|---|---|---|
| 2025 | $5,235 | $273,900 | $58,600 | $215,300 |
| 2024 | $5,134 | $120,300 | $38,300 | $82,000 |
| 2023 | $5,134 | $120,300 | $38,300 | $82,000 |
| 2022 | $4,642 | $120,300 | $38,300 | $82,000 |
| 2021 | $4,767 | $120,300 | $38,300 | $82,000 |
| 2020 | $4,271 | $120,300 | $38,300 | $82,000 |
| 2019 | $4,320 | $120,300 | $38,300 | $82,000 |
| 2018 | $4,343 | $120,300 | $38,300 | $82,000 |
| 2017 | $4,351 | $120,300 | $38,300 | $82,000 |
| 2016 | $4,273 | $120,300 | $38,300 | $82,000 |
| 2015 | $4,401 | $118,200 | $38,300 | $79,900 |
| 2014 | $4,338 | $78,000 | $18,300 | $59,700 |
Source: Public Records
Map
Nearby Homes