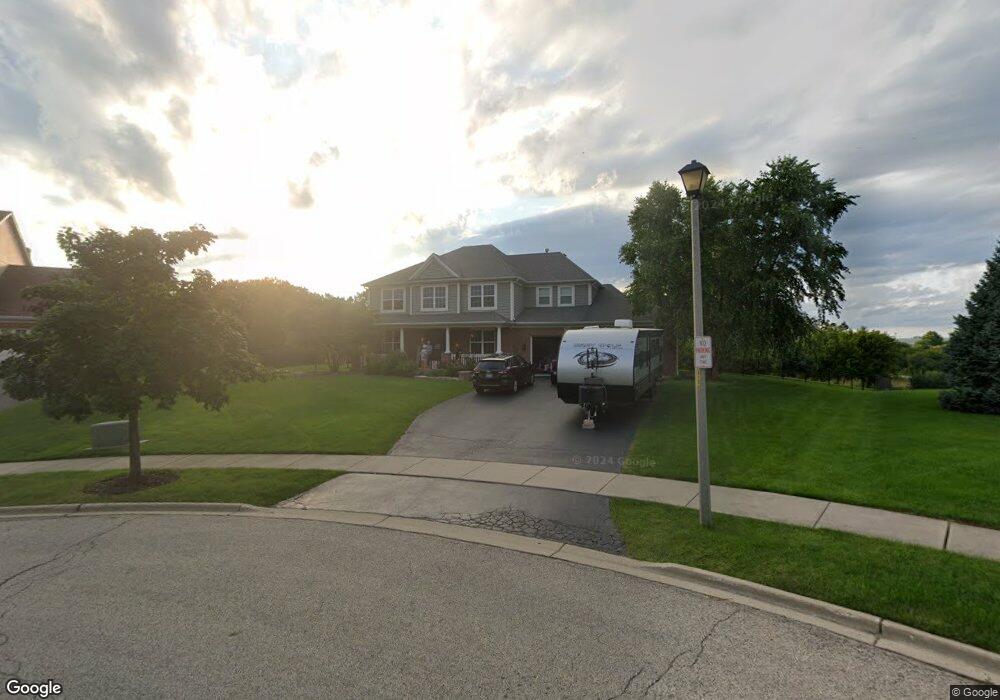
2278 Clearbrook Ct Wauconda, IL 60084
Estimated Value: $656,226 - $821,000
4
Beds
4
Baths
4,200
Sq Ft
$169/Sq Ft
Est. Value
About This Home
This home is located at 2278 Clearbrook Ct, Wauconda, IL 60084 and is currently estimated at $710,807, approximately $169 per square foot. 2278 Clearbrook Ct is a home located in Lake County with nearby schools including Robert Crown School, Wauconda Middle School, and Wauconda High School.
Ownership History
Date
Name
Owned For
Owner Type
Purchase Details
Closed on
Jul 1, 2025
Sold by
Friederich Kevin D and Friederich Renee E
Bought by
Kevin Daniel Friederich Trust and Renee Elizabeth Friederich Trust
Current Estimated Value
Purchase Details
Closed on
Dec 24, 2021
Sold by
Lawrence Pfeiffer Jr
Bought by
Friederich Kevin D and Friederich Renee E
Home Financials for this Owner
Home Financials are based on the most recent Mortgage that was taken out on this home.
Original Mortgage
$400,000
Interest Rate
3.38%
Mortgage Type
New Conventional
Purchase Details
Closed on
Jun 18, 2009
Sold by
Pfeiffer Kristin D
Bought by
Pfeiffer Lawrence
Purchase Details
Closed on
Feb 17, 2006
Sold by
Pinnacle Corp
Bought by
Pfeiffer Lawrence J and Pfeiffer Kristin D
Home Financials for this Owner
Home Financials are based on the most recent Mortgage that was taken out on this home.
Original Mortgage
$417,000
Interest Rate
5.62%
Mortgage Type
Unknown
Create a Home Valuation Report for This Property
The Home Valuation Report is an in-depth analysis detailing your home's value as well as a comparison with similar homes in the area
Home Values in the Area
Average Home Value in this Area
Purchase History
| Date | Buyer | Sale Price | Title Company |
|---|---|---|---|
| Kevin Daniel Friederich Trust | -- | Fidelity National Title | |
| Friederich Kevin D | $500,000 | New Title Company Name | |
| Pfeiffer Lawrence | -- | None Available | |
| Pfeiffer Lawrence J | $529,500 | Chicago Title Insurance Co |
Source: Public Records
Mortgage History
| Date | Status | Borrower | Loan Amount |
|---|---|---|---|
| Previous Owner | Friederich Kevin D | $400,000 | |
| Previous Owner | Pfeiffer Lawrence J | $417,000 |
Source: Public Records
Tax History Compared to Growth
Tax History
| Year | Tax Paid | Tax Assessment Tax Assessment Total Assessment is a certain percentage of the fair market value that is determined by local assessors to be the total taxable value of land and additions on the property. | Land | Improvement |
|---|---|---|---|---|
| 2024 | $17,136 | $187,006 | $43,786 | $143,220 |
| 2023 | $18,642 | $170,938 | $40,024 | $130,914 |
| 2022 | $18,642 | $166,650 | $44,702 | $121,948 |
| 2021 | $18,318 | $161,554 | $42,239 | $119,315 |
| 2020 | $17,797 | $153,978 | $40,258 | $113,720 |
| 2019 | $15,983 | $145,974 | $38,047 | $107,927 |
| 2018 | $18,901 | $163,547 | $65,829 | $97,718 |
| 2017 | $18,754 | $161,656 | $65,068 | $96,588 |
| 2016 | $17,569 | $153,083 | $61,617 | $91,466 |
| 2015 | $15,610 | $140,534 | $56,566 | $83,968 |
| 2014 | $15,359 | $133,252 | $55,200 | $78,052 |
| 2012 | $14,911 | $137,540 | $52,812 | $84,728 |
Source: Public Records
Map
Nearby Homes
- 29650 N Garland Rd
- 2227 Trailside Ln Unit 1B
- 2460 Savanna Dr
- 2511 Bluewater Dr Unit 1A
- 2810 Cattail Ct Unit B
- 2800 Cattail Ct Unit A
- 2820 Glacier Way Unit B
- 29564 N Garland Rd
- 29295 N Callahan Rd
- 28855 N Garland Rd
- 2800 Sweet Clover Way
- 28722 N Madison Ave
- 2490 Olivia Ct
- 2486 Olivia Ct
- 2472 Olivia Ct
- 2483 Olivia Ct
- 2403 Goldenrod Way
- 2373 Heron Ln
- 252 Purcell Rd
- 24570 W Chardon Rd
- 2276 Clearbrook Ct
- 2280 Clearbrook Ct
- 2282 Clearbrook Ct
- 2274 Clearbrook Ct
- 2272 Clearbrook Ct
- 2300 Serenity Ln
- 2270 Clearbrook Ct
- 2268 Clearbrook Ct
- 2302 Serenity Ln
- 2266 Clearbrook Ct
- 2304 Serenity Ln
- 2264 Clearbrook Ct Unit 1B
- 2306 Serenity Ln
- 29715 N Garland Rd
- 2308 Serenity Ln
- 2262 Clearbrook Ct
- 2256 Trailside Ln Unit 1B
- 2310 Serenity Ln
- 2258 Trailside Ln Unit 1B