2278 E Carriage Ln Unit 67 Salt Lake City, UT 84117
Estimated Value: $335,000 - $371,000
2
Beds
2
Baths
1,347
Sq Ft
$262/Sq Ft
Est. Value
About This Home
This home is located at 2278 E Carriage Ln Unit 67, Salt Lake City, UT 84117 and is currently estimated at $352,786, approximately $261 per square foot. 2278 E Carriage Ln Unit 67 is a home located in Salt Lake County with nearby schools including Howard R Driggs School, Olympus Junior High School, and Olympus High School.
Ownership History
Date
Name
Owned For
Owner Type
Purchase Details
Closed on
Nov 5, 2020
Sold by
Thomas Perrero and Thomas Carole Irene
Bought by
Perrero Monica Louise
Current Estimated Value
Purchase Details
Closed on
Dec 28, 2011
Sold by
Perrero Tom
Bought by
Perrero Thomas and Perrero Carole Irene
Purchase Details
Closed on
Aug 29, 2011
Sold by
Pettey Debra Ann Conley
Bought by
Perrero Tom
Purchase Details
Closed on
Sep 13, 2004
Sold by
Conley Jeannine W
Bought by
Conley Jeannine W and The Jeannine W Conley Family Living Trus
Purchase Details
Closed on
Jan 25, 2001
Sold by
Macrae Elizabeth
Bought by
Conley Willard G and Conley Jeannine W
Purchase Details
Closed on
Mar 25, 1998
Sold by
Hardy Kim M and Christensen Scott K
Bought by
Macrae Andrew and Macrae Elizabeth
Purchase Details
Closed on
Nov 20, 1997
Sold by
Dejulio Steven
Bought by
Hardy Kim M
Purchase Details
Closed on
Nov 19, 1997
Sold by
Hardy Kim M
Bought by
Hardy Kim M and Christensen Scott K
Purchase Details
Closed on
Sep 30, 1996
Sold by
Dejulio Douglas P and Dejulio Henrietta B
Bought by
Dejulio Douglas P and Dejulio Steven
Create a Home Valuation Report for This Property
The Home Valuation Report is an in-depth analysis detailing your home's value as well as a comparison with similar homes in the area
Home Values in the Area
Average Home Value in this Area
Purchase History
| Date | Buyer | Sale Price | Title Company |
|---|---|---|---|
| Perrero Monica Louise | -- | None Listed On Document | |
| Perrero Monica Louise | -- | None Available | |
| Perrero Thomas | -- | Accommodation | |
| Perrero Tom | -- | Eagle Gate Title Ins Agcy | |
| Conley Jeannine W | -- | Eagle Gate Title Ins Agcy | |
| Conley Willard G | -- | Associated Title | |
| Macrae Andrew | -- | -- | |
| Hardy Kim M | -- | -- | |
| Hardy Kim M | -- | -- | |
| Hardy Kim M | -- | -- | |
| Dejulio Douglas P | -- | -- |
Source: Public Records
Tax History Compared to Growth
Tax History
| Year | Tax Paid | Tax Assessment Tax Assessment Total Assessment is a certain percentage of the fair market value that is determined by local assessors to be the total taxable value of land and additions on the property. | Land | Improvement |
|---|---|---|---|---|
| 2025 | $1,557 | $302,600 | $90,800 | $211,800 |
| 2024 | $1,557 | $281,800 | $84,500 | $197,300 |
| 2023 | $1,558 | $274,700 | $82,400 | $192,300 |
| 2022 | $1,609 | $285,100 | $85,500 | $199,600 |
| 2021 | $1,418 | $218,300 | $65,500 | $152,800 |
| 2020 | $1,319 | $201,400 | $60,400 | $141,000 |
| 2019 | $1,332 | $198,000 | $59,400 | $138,600 |
| 2018 | $1,246 | $179,100 | $53,700 | $125,400 |
| 2017 | $1,045 | $158,600 | $47,600 | $111,000 |
| 2016 | $987 | $150,700 | $45,200 | $105,500 |
| 2015 | $1,007 | $143,400 | $43,000 | $100,400 |
| 2014 | $1,013 | $142,000 | $42,600 | $99,400 |
Source: Public Records
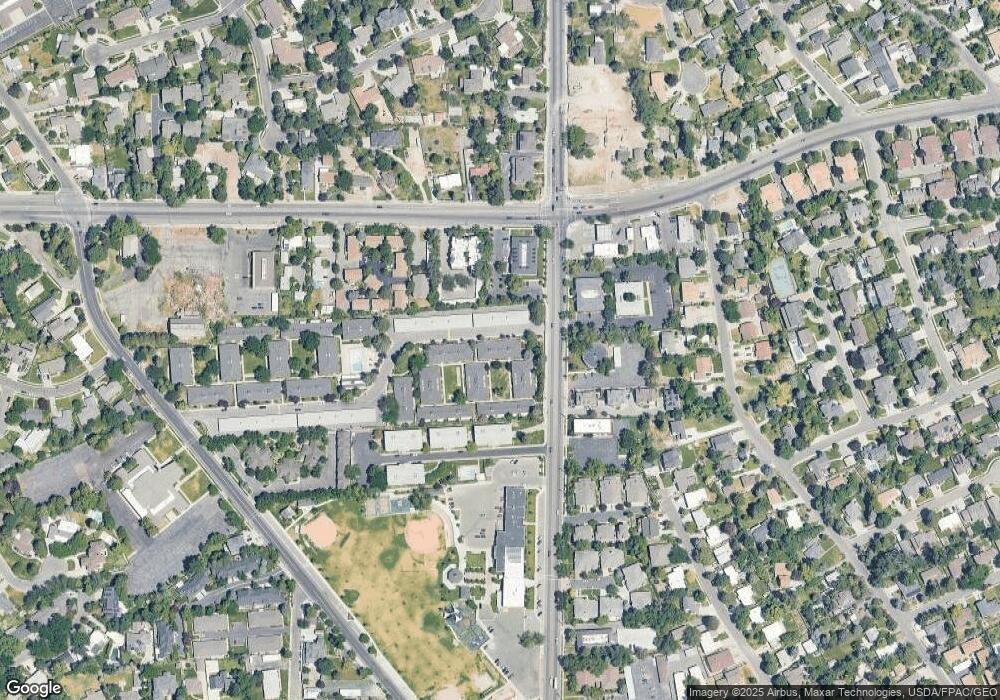
Map
Nearby Homes
- 2262 Carriage Ln Unit 66
- 2270 E 4500 S Unit 6A
- 2321 E John Holladay Ct
- 2263 E 4500 S
- 2219 E Carriage Ln Unit 59
- 4455 Holladay Park Ln
- 2209 E Carriage Ln Unit 42
- 2203 E Carriage Ln Unit 55
- 4442 Holladay Park Ln
- 2172 E Rising Wolf Ln Unit 16
- 2158 E Rising Wolf Ln Unit 22
- 2241 E Melodie Ann Way
- 4380 S Wander Ln
- 2369 E Murray Holladay Rd Unit 107
- 4559 S Kayland Cir
- 2451 E Murray Holladay Rd
- 4318 S 2300 E
- 4340 S Lynne Ln
- 2240 E Laney Ave Unit 302
- 2240 E Laney Ave Unit 102
- 2278 E Carriage Ln Unit 68
- 2286 E Carriage Ln Unit 84
- 2286 E Carriage Ln Unit 85
- 2286 E Carriage Ln Unit 83
- 2286 E Carriage Ln Unit 86
- 2286 E Carriage Ln
- 2286 E Carriage Ln
- 2286 E Carriage Ln Unit 84
- 2286 E Carriage Ln Unit 86
- 2286 E Carriage Ln Unit 83
- 2286 E Carriage Ln Unit 85
- 2278 Carriage Ln Unit 67
- 2278 Carriage Ln Unit 70
- 2278 Carriage Ln Unit 68
- 2278 Carriage Ln Unit 69
- 2278 Carriage Ln
- 2270 E Carriage Ln Unit 81
- 2270 E Carriage Ln Unit 82
- 2270 E Carriage Ln Unit 80
- 2270 E Carriage Ln Unit 79