Estimated Value: $399,000 - $416,000
4
Beds
2
Baths
2,322
Sq Ft
$175/Sq Ft
Est. Value
About This Home
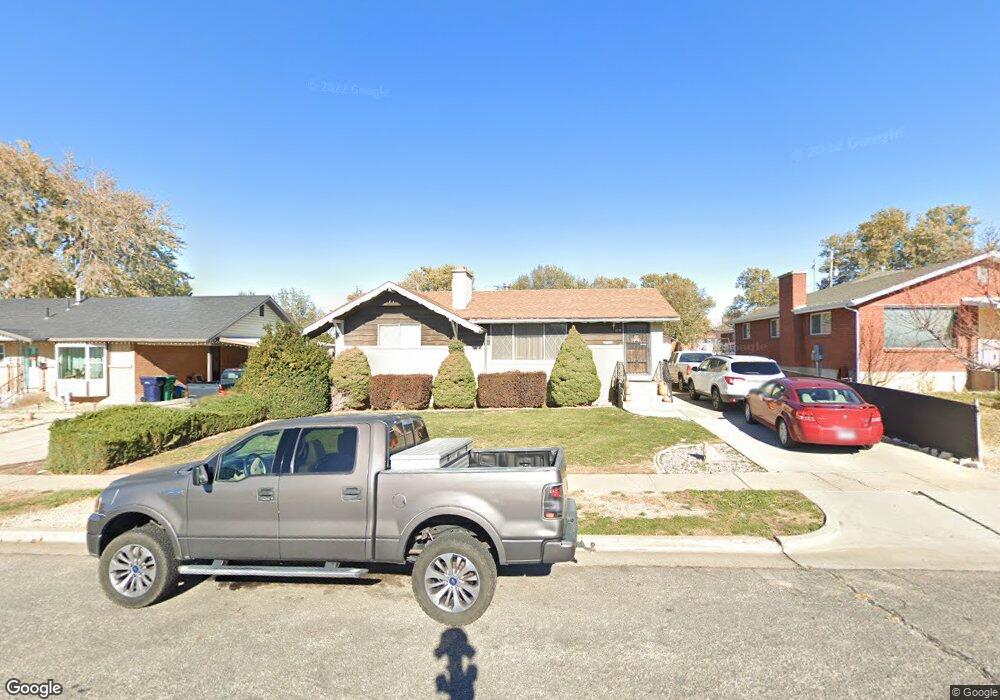
This home is located at 2278 W 5950 S, Roy, UT 84067 and is currently estimated at $405,267, approximately $174 per square foot. 2278 W 5950 S is a home located in Weber County with nearby schools including Municipal School, Roy Junior High School, and Roy High School.
Ownership History
Date
Name
Owned For
Owner Type
Purchase Details
Closed on
Mar 27, 2021
Sold by
Deborah Winkler Merrill Family Trust and Merrill Deborah Winkler
Bought by
Merrill Deborah Winkler
Current Estimated Value
Home Financials for this Owner
Home Financials are based on the most recent Mortgage that was taken out on this home.
Original Mortgage
$189,600
Outstanding Balance
$170,910
Interest Rate
2.9%
Mortgage Type
New Conventional
Estimated Equity
$234,357
Purchase Details
Closed on
Mar 17, 2021
Sold by
Merrill Deborah Winkler and The Deborah Winkler Merrill Fa
Bought by
Merrill Deborah Winkler
Home Financials for this Owner
Home Financials are based on the most recent Mortgage that was taken out on this home.
Original Mortgage
$189,600
Outstanding Balance
$170,910
Interest Rate
2.9%
Mortgage Type
New Conventional
Estimated Equity
$234,357
Purchase Details
Closed on
May 6, 2013
Sold by
Merrill Deborah Winkler
Bought by
Merrill Deborah Winkler and Deborah Winkler Merrill Family Trust
Purchase Details
Closed on
Oct 4, 2012
Sold by
Flitton Michael John and The Rex T And Alice H Flitton
Bought by
Merrill Deborah W
Purchase Details
Closed on
Aug 3, 2012
Sold by
Flitton Ref T and Flitton Alice
Bought by
Flitton Michael
Purchase Details
Closed on
Feb 29, 2012
Sold by
Flitton Michael J
Bought by
Flitton Rax T
Create a Home Valuation Report for This Property
The Home Valuation Report is an in-depth analysis detailing your home's value as well as a comparison with similar homes in the area
Home Values in the Area
Average Home Value in this Area
Purchase History
| Date | Buyer | Sale Price | Title Company |
|---|---|---|---|
| Merrill Deborah Winkler | -- | Amrock | |
| Merrill Deborah Winkler | -- | Amrock Llc | |
| Merrill Deborah Winkler | -- | None Available | |
| Merrill Deborah W | -- | Mountain View Title Ogden | |
| Merrill Deborah W | -- | Mountain View Title | |
| Flitton Michael | -- | None Available | |
| Flitton Rax T | -- | None Available |
Source: Public Records
Mortgage History
| Date | Status | Borrower | Loan Amount |
|---|---|---|---|
| Open | Merrill Deborah Winkler | $189,600 | |
| Closed | Merrill Deborah Winkler | $189,600 |
Source: Public Records
Tax History Compared to Growth
Tax History
| Year | Tax Paid | Tax Assessment Tax Assessment Total Assessment is a certain percentage of the fair market value that is determined by local assessors to be the total taxable value of land and additions on the property. | Land | Improvement |
|---|---|---|---|---|
| 2025 | $2,543 | $401,909 | $127,731 | $274,178 |
| 2024 | $2,499 | $397,999 | $127,747 | $270,252 |
| 2023 | $2,329 | $370,000 | $116,799 | $253,201 |
| 2022 | $2,567 | $424,000 | $101,326 | $322,674 |
| 2021 | $2,004 | $297,000 | $71,154 | $225,846 |
| 2020 | $1,908 | $260,000 | $71,154 | $188,846 |
| 2019 | $1,827 | $234,000 | $40,995 | $193,005 |
| 2018 | $1,803 | $218,000 | $38,976 | $179,024 |
| 2017 | $1,557 | $174,000 | $35,927 | $138,073 |
| 2016 | $1,494 | $89,694 | $17,548 | $72,146 |
| 2015 | $1,387 | $85,011 | $17,548 | $67,463 |
| 2014 | $1,399 | $85,010 | $17,548 | $67,462 |
Source: Public Records
Map
Nearby Homes