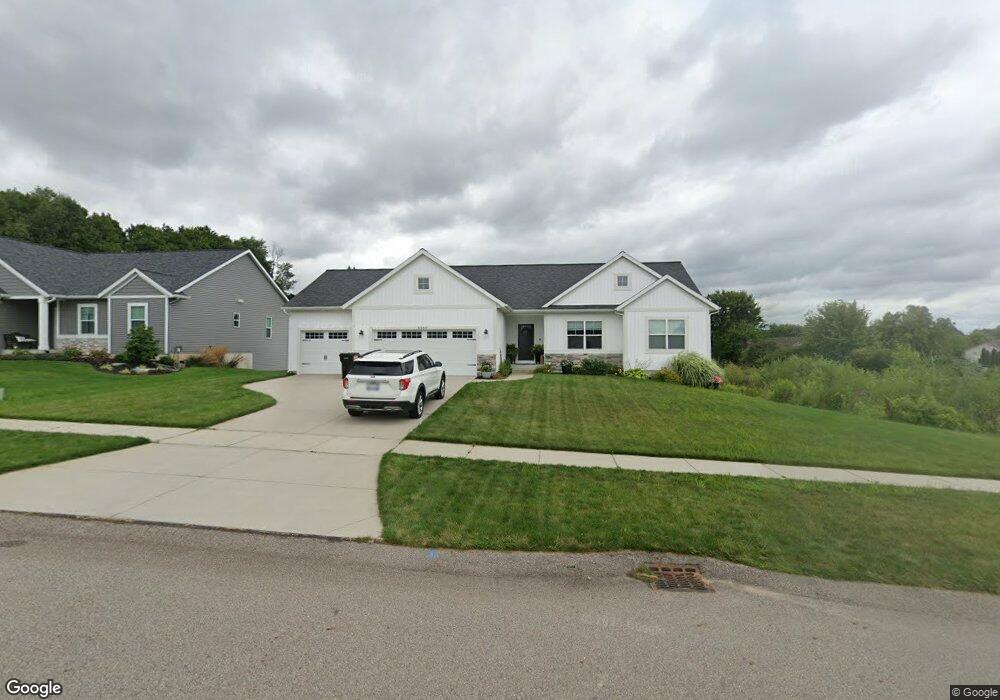
2278 Whistlehill Dr SW Byron Center, MI 49315
Estimated Value: $500,000 - $565,000
5
Beds
3
Baths
3,001
Sq Ft
$175/Sq Ft
Est. Value
About This Home
This home is located at 2278 Whistlehill Dr SW, Byron Center, MI 49315 and is currently estimated at $526,525, approximately $175 per square foot. 2278 Whistlehill Dr SW is a home located in Kent County with nearby schools including Marshall Elementary School, Robert L. Nickels Intermediate School, and Byron Center West Middle School.
Ownership History
Date
Name
Owned For
Owner Type
Purchase Details
Closed on
Jul 21, 2017
Sold by
Terbay Gregory J and Terbay Heather L
Bought by
Sprite Andrew
Current Estimated Value
Home Financials for this Owner
Home Financials are based on the most recent Mortgage that was taken out on this home.
Original Mortgage
$268,110
Outstanding Balance
$222,876
Interest Rate
3.91%
Mortgage Type
New Conventional
Estimated Equity
$303,649
Purchase Details
Closed on
Mar 10, 2009
Sold by
Sherrington Andrew M and Sherrington Kristi N
Bought by
Terbay Gregory J and Terbay Heather L
Home Financials for this Owner
Home Financials are based on the most recent Mortgage that was taken out on this home.
Original Mortgage
$216,015
Interest Rate
5.11%
Mortgage Type
FHA
Create a Home Valuation Report for This Property
The Home Valuation Report is an in-depth analysis detailing your home's value as well as a comparison with similar homes in the area
Home Values in the Area
Average Home Value in this Area
Purchase History
| Date | Buyer | Sale Price | Title Company |
|---|---|---|---|
| Sprite Andrew | $267,900 | Chicago Title Of Michigan In | |
| Terbay Gregory J | $220,000 | None Available |
Source: Public Records
Mortgage History
| Date | Status | Borrower | Loan Amount |
|---|---|---|---|
| Open | Sprite Andrew | $268,110 | |
| Previous Owner | Terbay Gregory J | $216,015 |
Source: Public Records
Tax History Compared to Growth
Tax History
| Year | Tax Paid | Tax Assessment Tax Assessment Total Assessment is a certain percentage of the fair market value that is determined by local assessors to be the total taxable value of land and additions on the property. | Land | Improvement |
|---|---|---|---|---|
| 2025 | $3,278 | $188,800 | $0 | $0 |
| 2024 | $3,278 | $181,500 | $0 | $0 |
| 2023 | $3,135 | $179,500 | $0 | $0 |
| 2022 | $4,369 | $161,000 | $0 | $0 |
| 2021 | $6,697 | $151,000 | $0 | $0 |
| 2020 | $4,091 | $134,000 | $0 | $0 |
| 2019 | $6,421 | $133,600 | $0 | $0 |
| 2018 | $6,421 | $130,600 | $20,500 | $110,100 |
| 2017 | $3,398 | $118,400 | $0 | $0 |
| 2016 | $3,270 | $114,200 | $0 | $0 |
| 2015 | $3,227 | $114,200 | $0 | $0 |
| 2013 | -- | $103,200 | $0 | $0 |
Source: Public Records
Map
Nearby Homes
- 2581 Ravines Trail Dr SW
- 2569 Ravines Trail Dr SW
- 2567 Ravines Trail Dr SW
- 2553 Ravines Trail Dr SW
- The Preston Plan at Alden Grove
- The Marley Plan at Alden Grove
- The Grayson Plan at Alden Grove
- The Crestview Plan at Alden Grove
- The Hadley Plan at Alden Grove
- The Maxwell Plan at Alden Grove
- The Stockton Plan at Alden Grove
- The Mayfair Plan at Alden Grove
- The Balsam Plan at Alden Grove
- The Newport Plan at Alden Grove
- The Sebastian Plan at Alden Grove
- The Jamestown Plan at Alden Grove
- The Georgetown Plan at Alden Grove
- The Fitzgerald Plan at Alden Grove
- The Sanibel Plan at Alden Grove
- The Wisteria Plan at Alden Grove
- 2270 Whistlehill Dr SW
- 2284 Whistlehill Dr SW
- 7518 Whistlevale Dr SW
- 7534 Whistlevale Dr SW
- 2260 Whistlehill Dr SW
- 2300 Whistlehill Dr SW
- 2285 Whistlevale Ct SW
- 2299 Whistlevale Ct SW
- 7448 Whistlehill Ct SW
- 2252 Whistlehill Dr
- 7443 Whistlehill Ct SW
- 2272 Whistlevale Ct SW
- 2221 76th St SW
- 7509 Whistlevale Dr SW
- 2309 Whistlehill Dr SW
- 7521 Whistlevale Dr SW
- 2240 Whistlehill Dr SW
- 7543 Whistlevale Dr SW
- 7430 Whistlehill Ct SW
- 7493 Whistlevale Dr SW