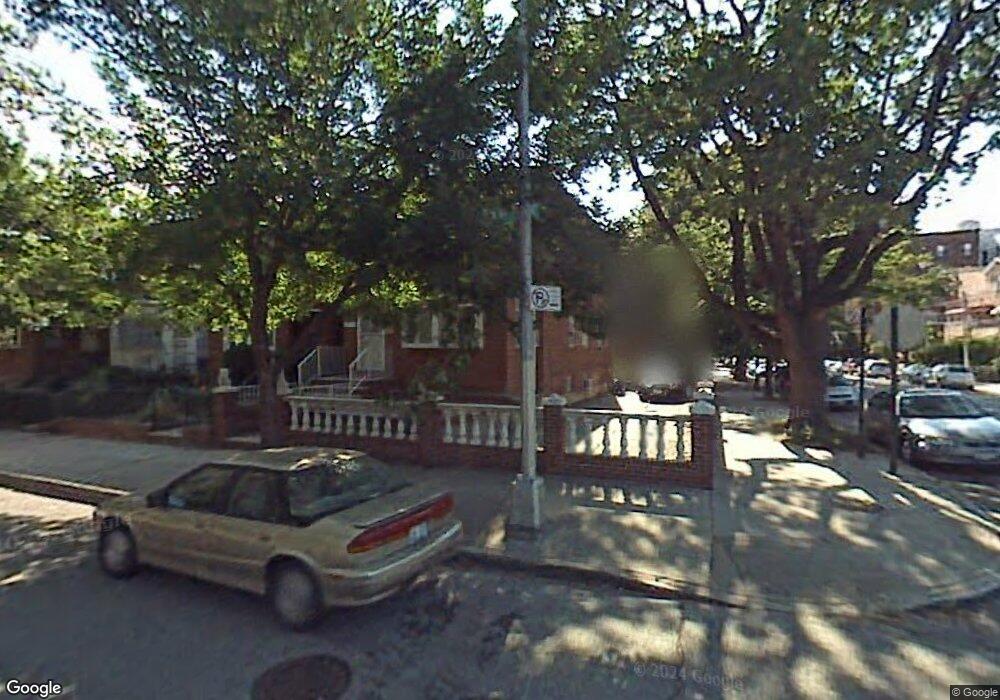
2279 19th St Astoria, NY 11105
Ditmars Steinway NeighborhoodEstimated Value: $1,238,646 - $1,735,000
1
Bed
--
Bath
715
Sq Ft
$2,065/Sq Ft
Est. Value
About This Home
This home is located at 2279 19th St, Astoria, NY 11105 and is currently estimated at $1,476,662, approximately $2,065 per square foot. 2279 19th St is a home located in Queens County with nearby schools including P.S. 122 Mamie Fay, Is 141 The Steinway, and Long Island City High School.
Ownership History
Date
Name
Owned For
Owner Type
Purchase Details
Closed on
Jan 14, 2015
Sold by
Alfaro Jennifer
Bought by
Kohlmeyer Patricia and Kohlmeyer Robert
Current Estimated Value
Home Financials for this Owner
Home Financials are based on the most recent Mortgage that was taken out on this home.
Original Mortgage
$707,000
Outstanding Balance
$540,931
Interest Rate
3.81%
Mortgage Type
Purchase Money Mortgage
Estimated Equity
$935,731
Purchase Details
Closed on
Mar 14, 2014
Sold by
Alafogiannis Rose Anne and Alfaro Alafogiannis Jennifer
Bought by
Alfaro Jennifer
Home Financials for this Owner
Home Financials are based on the most recent Mortgage that was taken out on this home.
Original Mortgage
$300,000
Interest Rate
4.26%
Mortgage Type
New Conventional
Purchase Details
Closed on
Jul 22, 2004
Sold by
Alafogiannis Rose Anne
Bought by
Alafogiannis Jennifer Alfaro and Alafogiannis Rose Anne
Create a Home Valuation Report for This Property
The Home Valuation Report is an in-depth analysis detailing your home's value as well as a comparison with similar homes in the area
Home Values in the Area
Average Home Value in this Area
Purchase History
| Date | Buyer | Sale Price | Title Company |
|---|---|---|---|
| Kohlmeyer Patricia | $1,085,000 | -- | |
| Kohlmeyer Patricia | $1,085,000 | -- | |
| Alfaro Jennifer | -- | -- | |
| Alfaro Jennifer | -- | -- | |
| Alafogiannis Jennifer Alfaro | -- | -- | |
| Alafogiannis Jennifer Alfaro | -- | -- |
Source: Public Records
Mortgage History
| Date | Status | Borrower | Loan Amount |
|---|---|---|---|
| Open | Kohlmeyer Patricia | $707,000 | |
| Closed | Kohlmeyer Patricia | $707,000 | |
| Previous Owner | Alfaro Jennifer | $300,000 | |
| Closed | Alafogiannis Jennifer Alfaro | $0 |
Source: Public Records
Tax History Compared to Growth
Tax History
| Year | Tax Paid | Tax Assessment Tax Assessment Total Assessment is a certain percentage of the fair market value that is determined by local assessors to be the total taxable value of land and additions on the property. | Land | Improvement |
|---|---|---|---|---|
| 2025 | $8,396 | $44,309 | $8,782 | $35,527 |
| 2024 | $8,396 | $41,803 | $9,076 | $32,727 |
| 2023 | $8,396 | $41,803 | $8,181 | $33,622 |
| 2022 | $8,282 | $76,980 | $15,840 | $61,140 |
| 2021 | $8,237 | $71,640 | $15,840 | $55,800 |
| 2020 | $7,816 | $61,620 | $15,840 | $45,780 |
| 2019 | $7,287 | $67,860 | $15,840 | $52,020 |
| 2018 | $7,101 | $34,836 | $8,270 | $26,566 |
| 2017 | $7,047 | $34,572 | $7,888 | $26,684 |
| 2016 | $6,520 | $34,572 | $7,888 | $26,684 |
| 2015 | $3,934 | $30,770 | $11,035 | $19,735 |
| 2014 | $3,934 | $29,030 | $12,490 | $16,540 |
Source: Public Records
Map
Nearby Homes
- 1916 23rd Rd
- 2112 22nd Dr
- 21-12 22nd Dr
- 21-12 22nd Dr Unit HOUSE
- 2120 23rd Dr
- 23-58 23rd St
- 19-19 24th Ave Unit R117
- 1840 21st Dr
- 24-01 23rd Ave
- 25-01 23rd Ave
- 23-05 24th Ave Unit 3-B
- 2162 24th St
- 21-62 24th St
- 21-31 Shore Blvd Unit 3C
- 21-31 Shore Blvd Unit 1D
- 21-31 Shore Blvd Unit 1E
- 21-31 Shore Blvd Unit 1G
- 21-31 Shore Blvd Unit 3D
- 21-31 Shore Blvd Unit 3E
- 21-31 Shore Blvd Unit 2F