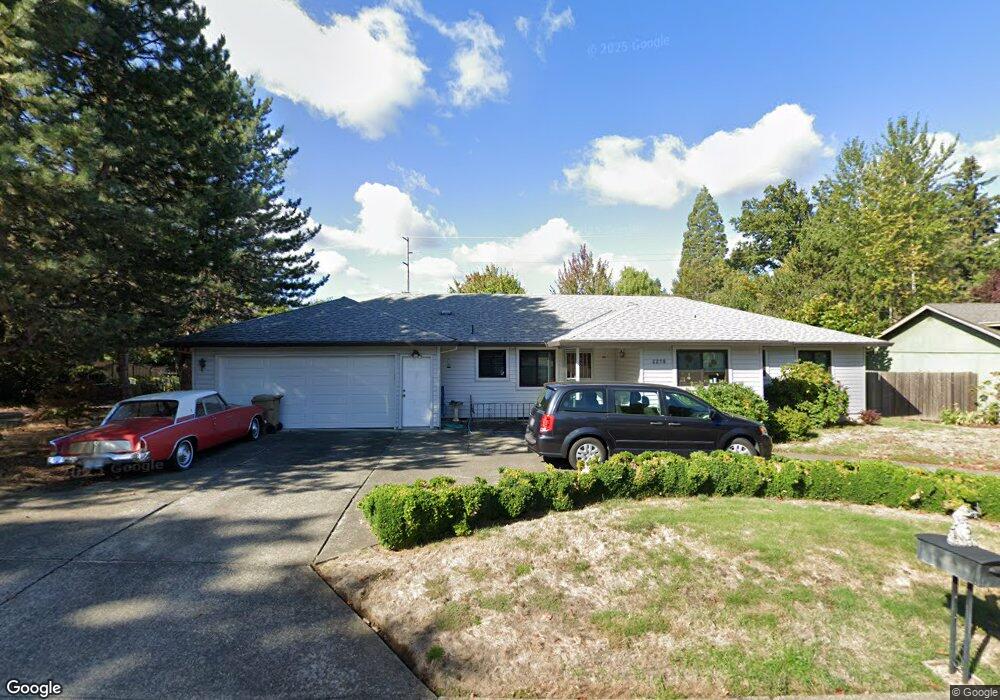
2279 SE Lindenbrook Ct Milwaukie, OR 97222
Estimated Value: $544,000 - $597,000
3
Beds
2
Baths
1,528
Sq Ft
$379/Sq Ft
Est. Value
About This Home
This home is located at 2279 SE Lindenbrook Ct, Milwaukie, OR 97222 and is currently estimated at $578,456, approximately $378 per square foot. 2279 SE Lindenbrook Ct is a home located in Clackamas County with nearby schools including Oak Grove Elementary School, Alder Creek Middle School, and Rex Putnam High School.
Ownership History
Date
Name
Owned For
Owner Type
Purchase Details
Closed on
Jan 9, 2017
Sold by
Austin Gary R
Bought by
Austin Gary R and Gary Austin Living Turst
Current Estimated Value
Purchase Details
Closed on
Dec 13, 2016
Sold by
Austin Garv R
Bought by
Austin Gary R
Purchase Details
Closed on
Jun 10, 2015
Sold by
Austin Gary R
Bought by
Austin Gary and The Gary Austin Living Trust
Purchase Details
Closed on
Mar 3, 2014
Sold by
Vaszary Janeece Drake and Austin Annaita Janeece
Bought by
Austin Gary
Purchase Details
Closed on
Oct 28, 2005
Sold by
Kahn Patricia D
Bought by
Austin Gary and Austin Annarita
Home Financials for this Owner
Home Financials are based on the most recent Mortgage that was taken out on this home.
Original Mortgage
$155,500
Interest Rate
5.68%
Mortgage Type
Fannie Mae Freddie Mac
Create a Home Valuation Report for This Property
The Home Valuation Report is an in-depth analysis detailing your home's value as well as a comparison with similar homes in the area
Home Values in the Area
Average Home Value in this Area
Purchase History
| Date | Buyer | Sale Price | Title Company |
|---|---|---|---|
| Austin Gary R | -- | Lawyers Title | |
| Austin Gary R | -- | Lawyers Title | |
| Austin Gary | -- | None Available | |
| Austin Gary | -- | None Available | |
| Austin Gary | $255,500 | Pacific Nw Title |
Source: Public Records
Mortgage History
| Date | Status | Borrower | Loan Amount |
|---|---|---|---|
| Previous Owner | Austin Gary | $155,500 | |
| Previous Owner | Austin Gary | $100,000 |
Source: Public Records
Tax History Compared to Growth
Tax History
| Year | Tax Paid | Tax Assessment Tax Assessment Total Assessment is a certain percentage of the fair market value that is determined by local assessors to be the total taxable value of land and additions on the property. | Land | Improvement |
|---|---|---|---|---|
| 2025 | $5,879 | $308,369 | -- | -- |
| 2024 | $5,671 | $299,388 | -- | -- |
| 2023 | $5,671 | $290,668 | $0 | $0 |
| 2022 | $5,217 | $282,202 | $0 | $0 |
| 2021 | $5,027 | $273,983 | $0 | $0 |
| 2020 | $4,871 | $266,003 | $0 | $0 |
| 2019 | $4,802 | $258,256 | $0 | $0 |
| 2018 | $4,205 | $250,734 | $0 | $0 |
| 2017 | $4,071 | $243,431 | $0 | $0 |
| 2016 | $3,928 | $236,341 | $0 | $0 |
| 2015 | $3,817 | $229,457 | $0 | $0 |
| 2014 | -- | $222,774 | $0 | $0 |
Source: Public Records
Map
Nearby Homes
- 13770 SE Linden Ln
- 14007 SE Cedar Ave
- 14368 SE Lee Ave
- 0 SE Cedar Ave
- 12735 SE 26th Ave
- 3396 SE Loeffelman Rd
- 14222 SE Laurie Ave
- 12556 SE 23rd Ave
- 12815 SE 31st Ave
- 12495 SE 23rd Ave
- 12425 SE 27th Ave
- 12437 SE 24th Ave
- 12712 SE 31st Ave
- 2850 SE Oak Grove Blvd
- 0 SE Sparrow St
- 985 SE Rim Rock Ln
- 12225 SE 19th Ave
- 14824 SE Kellogg Ave
- 14437 SE Hillgrove Ct
- 13078 Fielding Rd
- 2295 SE Lindenbrook Ct
- 2269 SE Lindenbrook Ct
- 2259 SE Lindenbrook Ct
- 2299 SE Lindenbrook Ct
- 2282 SE Lindenbrook Ct
- 2266 SE Torbank Rd
- 2303 SE Lindenbrook Ct
- 2284 SE Lindenbrook Ct
- 2360 SE Lindenbrook Ct
- 13730 SE Arista Dr
- 2208 SE Torbank Rd
- 2280 SE Lindenbrook Ct
- 2286 SE Lindenbrook Ct
- 2217 SE Torbank Rd
- 2400 SE Lindenbrook Ct
- 2357 SE Lindenbrook Ct
- 2450 SE Lindenbrook Ct
- 13309 SE Arista Dr
- 2205 SE Torbank Rd
- 2295 SE Courtney Rd