Estimated Value: $90,415 - $102,000
Studio
--
Bath
912
Sq Ft
$106/Sq Ft
Est. Value
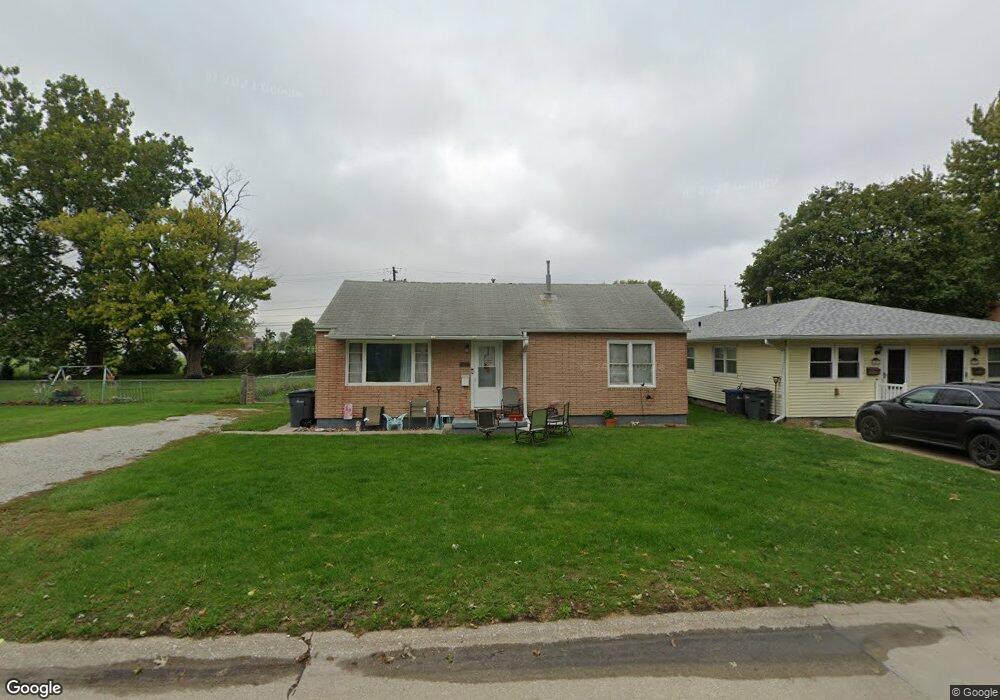
About This Home
This home is located at 228 4th St E, Milan, IL 61264 and is currently estimated at $96,854, approximately $106 per square foot. 228 4th St E is a home located in Rock Island County with nearby schools including Thomas Jefferson Elementary School, Edison Jr High School, and Rock Island High School.
Ownership History
Date
Name
Owned For
Owner Type
Purchase Details
Closed on
Nov 23, 2020
Sold by
Wright Rental Properties Llc-No 2
Bought by
Weinert Christine A
Current Estimated Value
Home Financials for this Owner
Home Financials are based on the most recent Mortgage that was taken out on this home.
Original Mortgage
$56,530
Outstanding Balance
$50,304
Interest Rate
2.8%
Mortgage Type
New Conventional
Estimated Equity
$46,550
Purchase Details
Closed on
May 1, 1992
Create a Home Valuation Report for This Property
The Home Valuation Report is an in-depth analysis detailing your home's value as well as a comparison with similar homes in the area
Home Values in the Area
Average Home Value in this Area
Purchase History
| Date | Buyer | Sale Price | Title Company |
|---|---|---|---|
| Weinert Christine A | $63,000 | Bozeman Neighbour Patton & Noe | |
| -- | $22,700 | -- |
Source: Public Records
Mortgage History
| Date | Status | Borrower | Loan Amount |
|---|---|---|---|
| Open | Weinert Christine A | $56,530 |
Source: Public Records
Tax History
| Year | Tax Paid | Tax Assessment Tax Assessment Total Assessment is a certain percentage of the fair market value that is determined by local assessors to be the total taxable value of land and additions on the property. | Land | Improvement |
|---|---|---|---|---|
| 2024 | $1,871 | $26,298 | $4,848 | $21,450 |
| 2023 | $1,871 | $24,578 | $4,531 | $20,047 |
| 2022 | $1,604 | $22,674 | $4,180 | $18,494 |
| 2021 | $1,561 | $21,471 | $3,958 | $17,513 |
| 2020 | $212 | $20,927 | $3,858 | $17,069 |
| 2019 | $2,070 | $20,720 | $3,820 | $16,900 |
| 2018 | $2,070 | $20,475 | $3,775 | $16,700 |
| 2017 | $1,890 | $20,094 | $3,705 | $16,389 |
| 2016 | $1,845 | $19,994 | $3,687 | $16,307 |
| 2015 | $1,849 | $19,889 | $3,668 | $16,221 |
| 2014 | $416 | $19,461 | $3,589 | $15,872 |
| 2013 | $416 | $19,461 | $3,589 | $15,872 |
Source: Public Records
Map
Nearby Homes
Your Personal Tour Guide
Ask me questions while you tour the home.