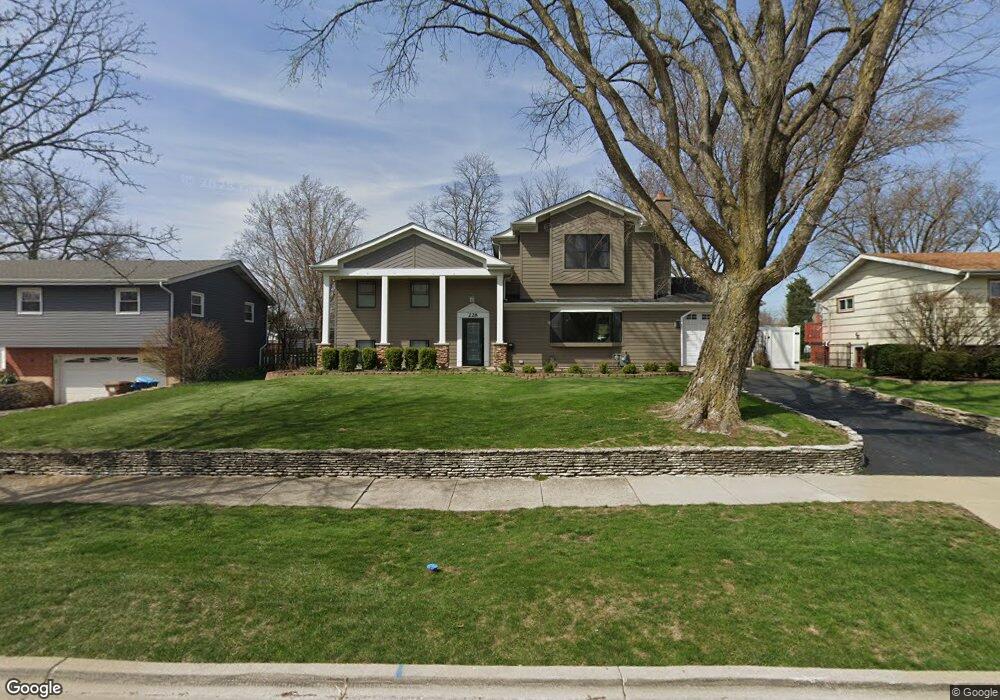
228 56th St Downers Grove, IL 60516
Estimated Value: $525,543 - $864,000
--
Bed
--
Bath
2,460
Sq Ft
$261/Sq Ft
Est. Value
About This Home
This home is located at 228 56th St, Downers Grove, IL 60516 and is currently estimated at $641,886, approximately $260 per square foot. 228 56th St is a home located in DuPage County with nearby schools including Fairmount Elementary School, O'Neill Middle School, and Downers Grove South High School.
Ownership History
Date
Name
Owned For
Owner Type
Purchase Details
Closed on
Jul 10, 1998
Sold by
Lipuma Francis and Lipuma Karyn M
Bought by
Kim Dziewinski John T and Kim Dziewsinki
Current Estimated Value
Create a Home Valuation Report for This Property
The Home Valuation Report is an in-depth analysis detailing your home's value as well as a comparison with similar homes in the area
Home Values in the Area
Average Home Value in this Area
Purchase History
| Date | Buyer | Sale Price | Title Company |
|---|---|---|---|
| Kim Dziewinski John T | -- | -- |
Source: Public Records
Tax History Compared to Growth
Tax History
| Year | Tax Paid | Tax Assessment Tax Assessment Total Assessment is a certain percentage of the fair market value that is determined by local assessors to be the total taxable value of land and additions on the property. | Land | Improvement |
|---|---|---|---|---|
| 2024 | $8,589 | $158,025 | $68,597 | $89,428 |
| 2023 | $8,160 | $145,270 | $63,060 | $82,210 |
| 2022 | $7,861 | $139,570 | $60,590 | $78,980 |
| 2021 | $7,358 | $137,980 | $59,900 | $78,080 |
| 2020 | $7,220 | $135,240 | $58,710 | $76,530 |
| 2019 | $6,989 | $129,760 | $56,330 | $73,430 |
| 2018 | $7,101 | $130,240 | $56,000 | $74,240 |
| 2017 | $6,189 | $113,420 | $53,890 | $59,530 |
| 2016 | $5,905 | $105,570 | $51,470 | $54,100 |
| 2015 | $5,837 | $99,320 | $48,420 | $50,900 |
| 2014 | $5,796 | $96,570 | $47,080 | $49,490 |
| 2013 | $4,626 | $96,120 | $46,860 | $49,260 |
Source: Public Records
Map
Nearby Homes
- 5518 Wilcox Ave
- 205 White Fawn Trail
- 232 55th St
- 5519 Fairview Ave
- 128 8th St
- 5632 Fairview Ave
- 5740 Raintree Ln
- 5836 Doe Cir Unit 11
- 5316 Fairview Ave
- 5341 Grand Ave
- 532 W 59th St
- 500 Bunning Dr
- 315 S Park St
- 440 Lindley Ave
- 425 Hill St
- 525 Bunning Dr
- 305 3rd St
- 5201 Florence Ave
- 302 S Washington St
- 6030 Fairview Ave