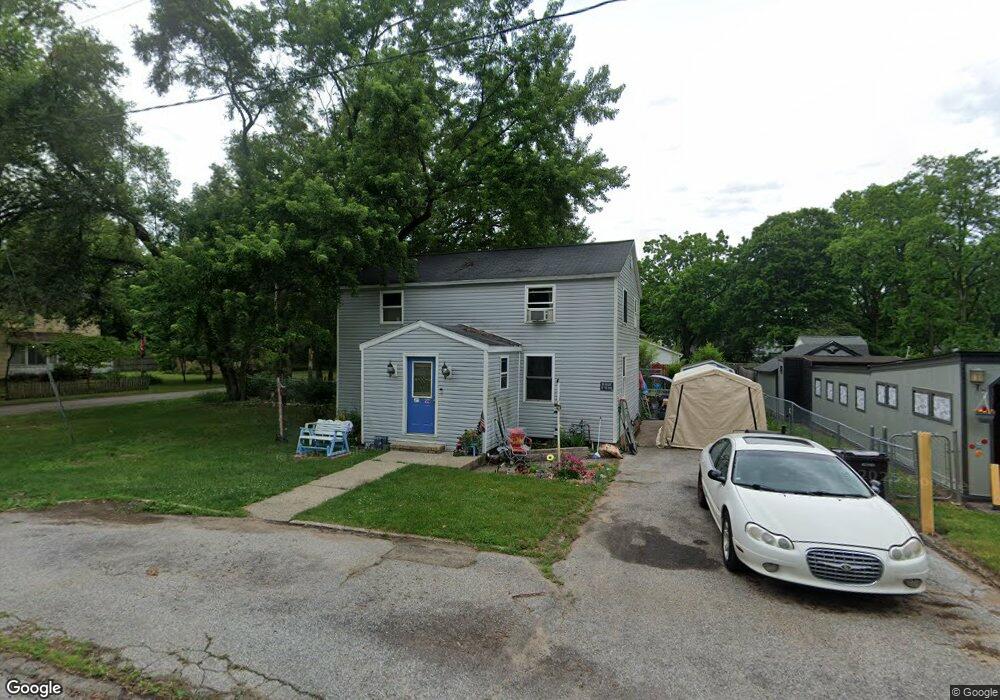
228 5th St Allegan, MI 49010
Estimated Value: $189,000 - $193,125
3
Beds
2
Baths
1,240
Sq Ft
$154/Sq Ft
Est. Value
About This Home
This home is located at 228 5th St, Allegan, MI 49010 and is currently estimated at $191,531, approximately $154 per square foot. 228 5th St is a home located in Allegan County with nearby schools including Pine Trails Elementary School, L.E. White Middle School, and Allegan High School.
Ownership History
Date
Name
Owned For
Owner Type
Purchase Details
Closed on
Jun 30, 2005
Sold by
Bradshaw Randy
Bought by
Rewalt Paul and Rewalt Renea
Current Estimated Value
Home Financials for this Owner
Home Financials are based on the most recent Mortgage that was taken out on this home.
Original Mortgage
$68,800
Outstanding Balance
$44,356
Interest Rate
9.55%
Mortgage Type
Purchase Money Mortgage
Estimated Equity
$147,175
Purchase Details
Closed on
Jun 26, 2000
Sold by
Bradshaw Becky
Bought by
Bradshaw Randy
Purchase Details
Closed on
Dec 12, 1990
Purchase Details
Closed on
Jun 1, 1984
Create a Home Valuation Report for This Property
The Home Valuation Report is an in-depth analysis detailing your home's value as well as a comparison with similar homes in the area
Home Values in the Area
Average Home Value in this Area
Purchase History
| Date | Buyer | Sale Price | Title Company |
|---|---|---|---|
| Rewalt Paul | $86,000 | Nations Title Agency Of Mi | |
| Bradshaw Randy | -- | -- | |
| -- | $34,400 | -- | |
| -- | $33,700 | -- |
Source: Public Records
Mortgage History
| Date | Status | Borrower | Loan Amount |
|---|---|---|---|
| Open | Rewalt Paul | $68,800 |
Source: Public Records
Tax History Compared to Growth
Tax History
| Year | Tax Paid | Tax Assessment Tax Assessment Total Assessment is a certain percentage of the fair market value that is determined by local assessors to be the total taxable value of land and additions on the property. | Land | Improvement |
|---|---|---|---|---|
| 2025 | $1,190 | $63,200 | $13,200 | $50,000 |
| 2024 | $1,083 | $54,900 | $11,500 | $43,400 |
| 2023 | $1,122 | $43,200 | $10,900 | $32,300 |
| 2022 | $1,083 | $37,400 | $9,000 | $28,400 |
| 2021 | $1,035 | $35,000 | $7,200 | $27,800 |
| 2020 | $1,020 | $35,200 | $6,600 | $28,600 |
| 2019 | $995 | $32,800 | $6,300 | $26,500 |
| 2018 | $956 | $28,200 | $6,200 | $22,000 |
| 2017 | $0 | $26,100 | $5,200 | $20,900 |
| 2016 | $0 | $21,300 | $4,300 | $17,000 |
| 2015 | -- | $21,300 | $4,300 | $17,000 |
| 2014 | -- | $23,000 | $4,300 | $18,700 |
| 2013 | $1,534 | $25,400 | $4,300 | $21,100 |
Source: Public Records
Map
Nearby Homes