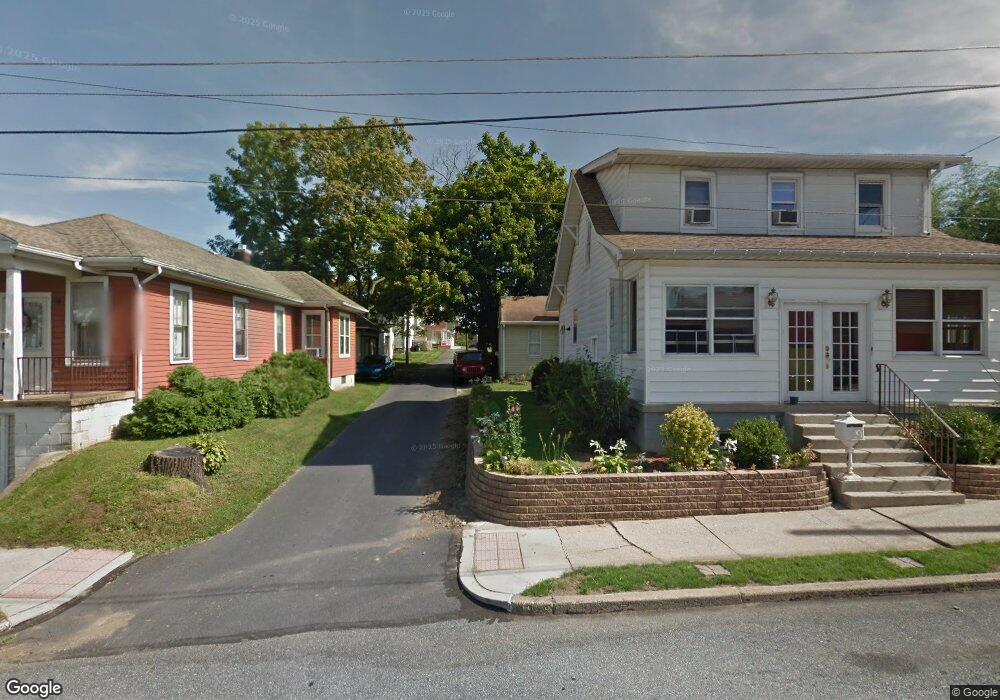
228 8th St New Cumberland, PA 17070
Estimated Value: $64,000 - $165,000
2
Beds
1
Bath
500
Sq Ft
$257/Sq Ft
Est. Value
About This Home
This home is located at 228 8th St, New Cumberland, PA 17070 and is currently estimated at $128,683, approximately $257 per square foot. 228 8th St is a home located in Cumberland County with nearby schools including Hillside Elementary School, New Cumberland Middle School, and Cedar Cliff High School.
Ownership History
Date
Name
Owned For
Owner Type
Purchase Details
Closed on
Mar 12, 2021
Sold by
We Buy Pa Inc
Bought by
Spg Capital Llc
Current Estimated Value
Home Financials for this Owner
Home Financials are based on the most recent Mortgage that was taken out on this home.
Original Mortgage
$51,000
Outstanding Balance
$45,718
Interest Rate
2.7%
Mortgage Type
Commercial
Estimated Equity
$82,965
Create a Home Valuation Report for This Property
The Home Valuation Report is an in-depth analysis detailing your home's value as well as a comparison with similar homes in the area
Home Values in the Area
Average Home Value in this Area
Purchase History
| Date | Buyer | Sale Price | Title Company |
|---|---|---|---|
| Spg Capital Llc | $51,000 | None Available | |
| We Buy Pa Inc | $33,000 | None Available |
Source: Public Records
Mortgage History
| Date | Status | Borrower | Loan Amount |
|---|---|---|---|
| Open | Spg Capital Llc | $51,000 |
Source: Public Records
Tax History Compared to Growth
Tax History
| Year | Tax Paid | Tax Assessment Tax Assessment Total Assessment is a certain percentage of the fair market value that is determined by local assessors to be the total taxable value of land and additions on the property. | Land | Improvement |
|---|---|---|---|---|
| 2025 | $1,249 | $58,400 | $25,000 | $33,400 |
| 2024 | $1,183 | $58,400 | $25,000 | $33,400 |
| 2023 | $1,134 | $58,400 | $25,000 | $33,400 |
| 2022 | $1,104 | $58,400 | $25,000 | $33,400 |
| 2021 | $1,079 | $58,400 | $25,000 | $33,400 |
| 2020 | $1,063 | $58,400 | $25,000 | $33,400 |
| 2019 | $1,046 | $58,400 | $25,000 | $33,400 |
| 2018 | $1,020 | $58,400 | $25,000 | $33,400 |
| 2017 | $1,003 | $58,400 | $25,000 | $33,400 |
| 2016 | -- | $58,400 | $25,000 | $33,400 |
| 2015 | -- | $58,400 | $25,000 | $33,400 |
| 2014 | -- | $58,400 | $25,000 | $33,400 |
Source: Public Records
Map
Nearby Homes
- 319 7th St
- 312 10th St
- 315 10th St
- 414 5th St
- 409 1/2 Market St
- 211 Market St
- 337 Evergreen St
- 400 Woodland Ave
- 137 15th St
- 123 15th St
- 134 S Market St
- 8 Umberto Ave
- 1534 Brandt Ave
- 617 Brookhaven Rd
- 716 Elkwood Dr
- 1601 Cobble Ct
- 110 Ross Ave Unit 2
- 1726 Josiah Chowning Way
- 1764 Peyton Randolph Ct
- 103 Parkview Rd