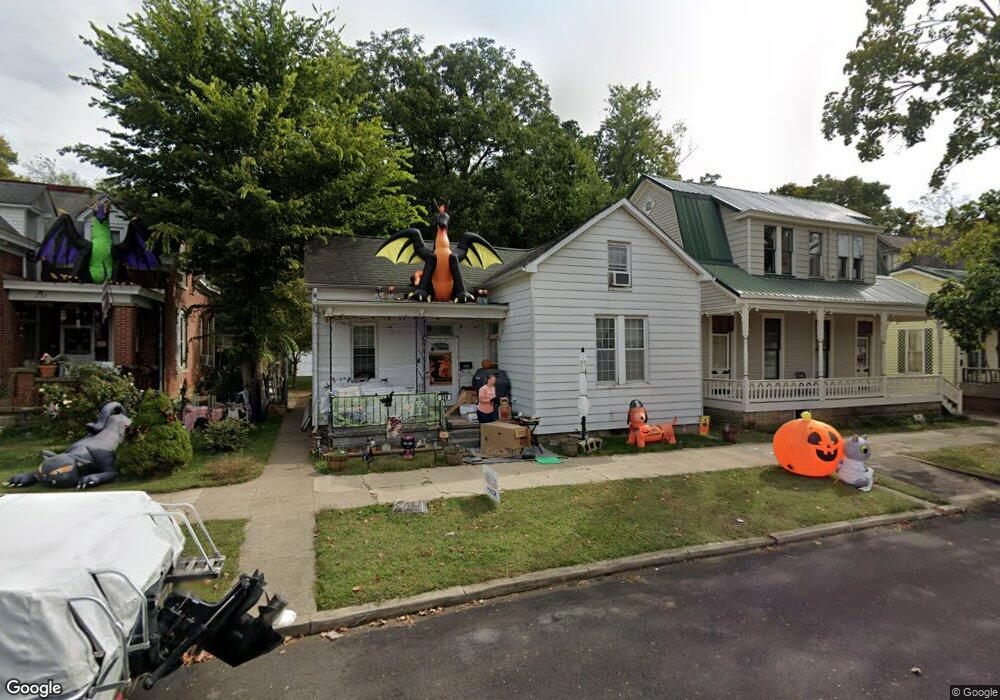
228 9th St Tell City, IN 47586
Estimated Value: $105,000 - $141,000
2
Beds
1
Bath
1,836
Sq Ft
$65/Sq Ft
Est. Value
About This Home
This home is located at 228 9th St, Tell City, IN 47586 and is currently estimated at $120,216, approximately $65 per square foot. 228 9th St is a home located in Perry County with nearby schools including William Tell Elementary School, Tell City Junior/Senior High School, and Agape Christian Academy.
Ownership History
Date
Name
Owned For
Owner Type
Purchase Details
Closed on
Oct 18, 2010
Sold by
Fannie Mae
Bought by
Cail Brian Mack
Current Estimated Value
Purchase Details
Closed on
Jun 28, 2010
Sold by
Gmac Mortgage Llc
Bought by
Fannie Mae and Federal National Mortgage Association
Purchase Details
Closed on
Jun 14, 2010
Sold by
Holloway Naomi
Bought by
Gmac Mortgage Llc
Purchase Details
Closed on
Feb 17, 2006
Sold by
Jackson Alphonso
Bought by
Holloway Naomi
Purchase Details
Closed on
Oct 25, 2005
Sold by
National City Bank Of Oklahoma
Bought by
Secretary Of Hud
Purchase Details
Closed on
Oct 12, 2005
Sold by
Harding Bradley and James Michelle
Bought by
National City Bank
Create a Home Valuation Report for This Property
The Home Valuation Report is an in-depth analysis detailing your home's value as well as a comparison with similar homes in the area
Home Values in the Area
Average Home Value in this Area
Purchase History
| Date | Buyer | Sale Price | Title Company |
|---|---|---|---|
| Cail Brian Mack | -- | None Available | |
| Fannie Mae | -- | None Available | |
| Gmac Mortgage Llc | -- | None Available | |
| Holloway Naomi | -- | None Available | |
| Secretary Of Hud | -- | None Available | |
| National City Bank | $74,784 | None Available |
Source: Public Records
Tax History Compared to Growth
Tax History
| Year | Tax Paid | Tax Assessment Tax Assessment Total Assessment is a certain percentage of the fair market value that is determined by local assessors to be the total taxable value of land and additions on the property. | Land | Improvement |
|---|---|---|---|---|
| 2024 | $456 | $60,300 | $4,700 | $55,600 |
| 2023 | $447 | $58,100 | $4,700 | $53,400 |
| 2022 | $328 | $54,300 | $4,700 | $49,600 |
| 2021 | $269 | $41,500 | $4,700 | $36,800 |
| 2020 | $230 | $39,200 | $4,700 | $34,500 |
| 2019 | $258 | $42,200 | $4,600 | $37,600 |
| 2018 | $263 | $42,200 | $4,500 | $37,700 |
| 2017 | $344 | $51,600 | $4,500 | $47,100 |
| 2016 | $348 | $51,600 | $4,500 | $47,100 |
| 2014 | $376 | $52,100 | $4,500 | $47,600 |
| 2013 | $376 | $50,500 | $4,500 | $46,000 |
Source: Public Records
Map
Nearby Homes