R
Seller's Agent in 2025
Ryan Wilson
TK Realty
(817) 504-6498
7 in this area
49 Total Sales
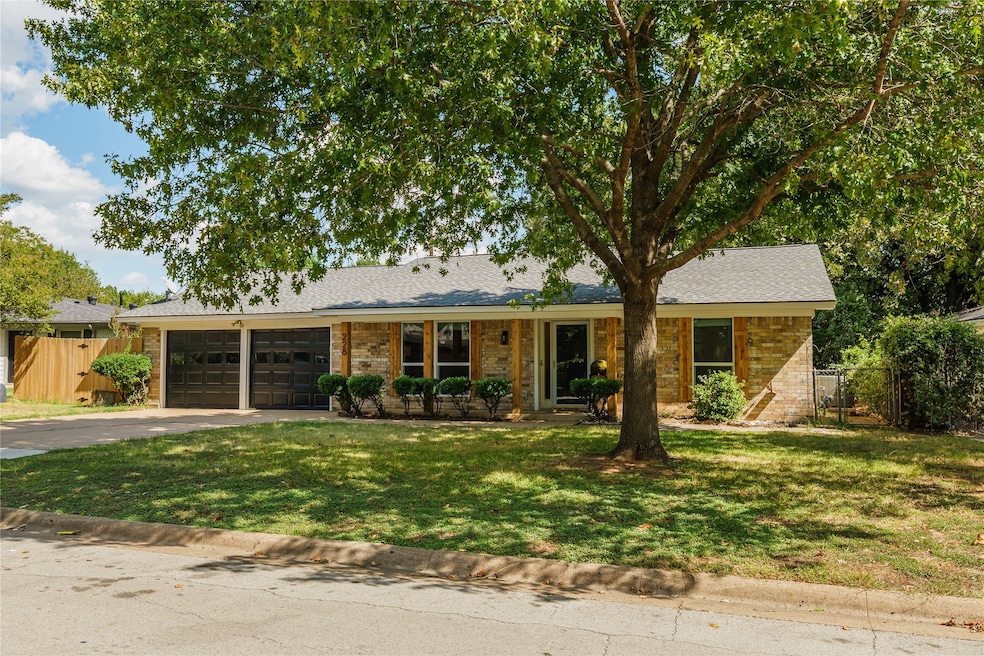


Welcome to 228 Arcadia St — a beautifully updated home situated on an oversized lot in the heart of Hurst. This stylish 3-bedroom, 2-bathroom residence blends modern comfort with timeless design. Inside, you’ll find elegant white oak flooring complemented by rich natural oak cabinetry, creating a warm, cohesive look throughout. The open-concept living space is enhanced by designer light fixtures that bring a touch of luxury to each room. The spacious kitchen is perfect for the home chef, offering generous storage and an ideal layout for entertaining. Step outside to enjoy a large backyard shaded by mature trees and a wide side driveway, providing plenty of space for gatherings and outdoor fun. Other items include brand new windows, one year old roof, 3 year old HVAC and updated plumbing
Last Agent to Sell the Property
TK Realty Brokerage Phone: 817-504-6498 License #0689501 Listed on: 11/21/2025
| Date | Type | Sale Price | Title Company |
|---|---|---|---|
| Warranty Deed | -- | None Listed On Document | |
| Deed | -- | None Listed On Document | |
| Special Warranty Deed | -- | None Listed On Document | |
| Vendors Lien | -- | Safeco Land Title |
| Date | Status | Loan Amount | Loan Type |
|---|---|---|---|
| Previous Owner | $187,200 | New Conventional | |
| Previous Owner | $104,500 | Purchase Money Mortgage |
| Date | Event | Price | List to Sale | Price per Sq Ft |
|---|---|---|---|---|
| 12/31/2025 12/31/25 | Sold | -- | -- | -- |
| 12/17/2025 12/17/25 | Pending | -- | -- | -- |
| 11/21/2025 11/21/25 | For Sale | $329,000 | -- | $212 / Sq Ft |
| Year | Tax Paid | Tax Assessment Tax Assessment Total Assessment is a certain percentage of the fair market value that is determined by local assessors to be the total taxable value of land and additions on the property. | Land | Improvement |
|---|---|---|---|---|
| 2025 | $3,827 | $186,325 | $50,400 | $135,925 |
| 2024 | $3,827 | $186,325 | $50,400 | $135,925 |
| 2023 | $3,827 | $191,047 | $42,000 | $149,047 |
| 2022 | $3,906 | $169,661 | $42,000 | $127,661 |
| 2021 | $3,956 | $164,049 | $50,000 | $114,049 |
| 2020 | $4,282 | $178,000 | $50,000 | $128,000 |
| 2019 | $3,794 | $155,000 | $50,000 | $105,000 |
| 2018 | $3,794 | $155,000 | $25,000 | $130,000 |
| 2017 | $3,764 | $148,748 | $25,000 | $123,748 |
| 2016 | $3,614 | $142,799 | $25,000 | $117,799 |
| 2015 | $3,011 | $114,800 | $20,000 | $94,800 |
| 2014 | $3,011 | $114,800 | $20,000 | $94,800 |
R
Seller's Agent in 2025
Ryan Wilson
TK Realty
(817) 504-6498
7 in this area
49 Total Sales

Buyer's Agent in 2025
Sue Wykes
Coldwell Banker Realty
(214) 783-3607
2 in this area
98 Total Sales
Source: North Texas Real Estate Information Systems (NTREIS)
MLS Number: 21118421
APN: 01387405
Disclaimer: Certain information contained herein is derived from information provided by parties other than Homes.com. All information provided is deemed reliable, but is not guaranteed to be accurate and should be independently verified.
![]() Listing information provided in part by the North Texas Real Estate Information Systems, Inc, for personal, non-commercial use by viewers of this site and may not be reproduced or redistributed. All information is deemed reliable but not guaranteed. Copyright © NTREIS 2026. All rights reserved
Listing information provided in part by the North Texas Real Estate Information Systems, Inc, for personal, non-commercial use by viewers of this site and may not be reproduced or redistributed. All information is deemed reliable but not guaranteed. Copyright © NTREIS 2026. All rights reserved
Ask me questions while you tour the home.