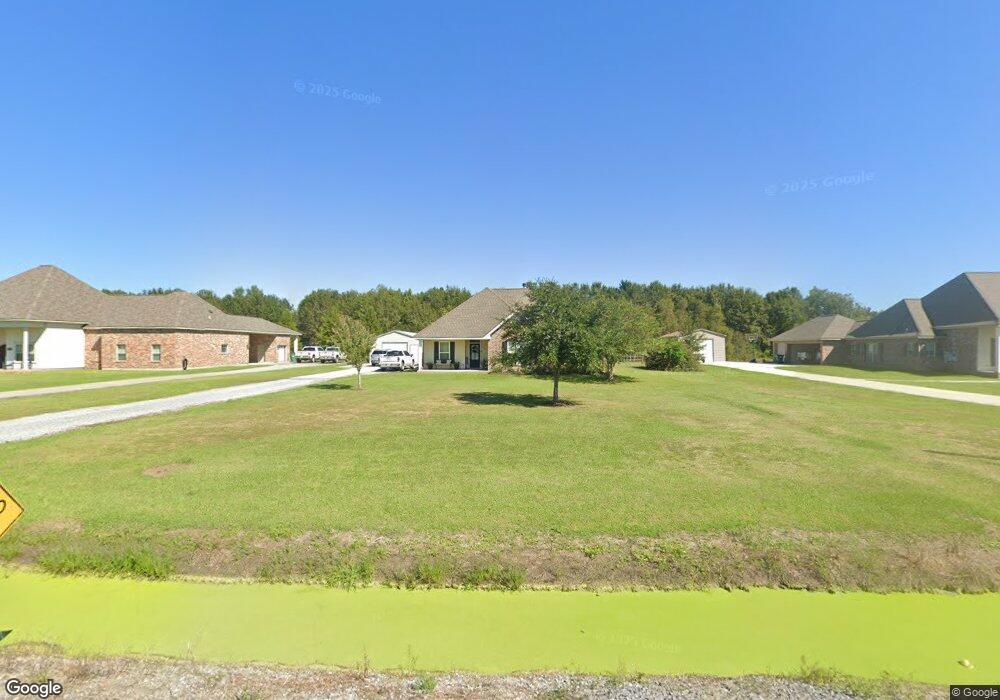
228 Baja Trail Thibodaux, LA 70301
Estimated Value: $308,170 - $392,000
--
Bed
--
Bath
1,518
Sq Ft
$227/Sq Ft
Est. Value
About This Home
This home is located at 228 Baja Trail, Thibodaux, LA 70301 and is currently estimated at $345,043, approximately $227 per square foot. 228 Baja Trail is a home with nearby schools including St. Charles Elementary School, East Thibodaux Middle School, and Thibodaux High School.
Ownership History
Date
Name
Owned For
Owner Type
Purchase Details
Closed on
Jun 15, 2022
Sold by
James Hebert Matt and Lecompte Allyson
Bought by
Kling Branden Joseph
Current Estimated Value
Home Financials for this Owner
Home Financials are based on the most recent Mortgage that was taken out on this home.
Original Mortgage
$275,000
Outstanding Balance
$261,572
Interest Rate
5.23%
Mortgage Type
New Conventional
Estimated Equity
$83,471
Purchase Details
Closed on
Oct 31, 2016
Sold by
Laday Construction Llc
Bought by
Milstead James Edward and Milstead Tiffany Ledet
Purchase Details
Closed on
May 20, 2015
Sold by
Low Land Investors Llc
Bought by
Hebert Matt James and Hebert Allyson Lecompte
Home Financials for this Owner
Home Financials are based on the most recent Mortgage that was taken out on this home.
Original Mortgage
$171,064
Interest Rate
3.68%
Mortgage Type
Future Advance Clause Open End Mortgage
Create a Home Valuation Report for This Property
The Home Valuation Report is an in-depth analysis detailing your home's value as well as a comparison with similar homes in the area
Home Values in the Area
Average Home Value in this Area
Purchase History
| Date | Buyer | Sale Price | Title Company |
|---|---|---|---|
| Kling Branden Joseph | $325,000 | None Listed On Document | |
| Milstead James Edward | $347,000 | None Available | |
| Hebert Matt James | $49,900 | None Available |
Source: Public Records
Mortgage History
| Date | Status | Borrower | Loan Amount |
|---|---|---|---|
| Open | Kling Branden Joseph | $275,000 | |
| Previous Owner | Hebert Matt James | $171,064 |
Source: Public Records
Tax History Compared to Growth
Tax History
| Year | Tax Paid | Tax Assessment Tax Assessment Total Assessment is a certain percentage of the fair market value that is determined by local assessors to be the total taxable value of land and additions on the property. | Land | Improvement |
|---|---|---|---|---|
| 2023 | $1,958 | $22,000 | $5,000 | $17,000 |
| 2022 | $2,963 | $22,000 | $5,000 | $17,000 |
| 2021 | $2,345 | $22,000 | $5,000 | $17,000 |
| 2020 | $2,711 | $22,000 | $5,000 | $17,000 |
| 2019 | $2,303 | $18,160 | $4,500 | $13,660 |
| 2018 | $2,304 | $18,160 | $4,500 | $13,660 |
| 2017 | $2,365 | $18,160 | $4,500 | $13,660 |
| 2016 | $1,273 | $18,160 | $4,500 | $13,660 |
| 2015 | $487 | $4,020 | $0 | $0 |
Source: Public Records
Map
Nearby Homes
- 159 Baja Trail
- 248 Chisholm Trail
- 236 Baja Trail
- 254 Baja Trail
- 251 Bayou Vista Dr
- 1294 Burma Rd
- 131 Peanut Ln
- 720 Lefort Bypass Rd
- 852 Lefort Bypass Rd
- 146 Bayou Vista Dr
- 113 Coon Dr
- 120 Bayou Vista Dr
- 1408
- 807 S Waterplant Rd
- 525 Supercharge Dr
- 317 Thoroughbred Park Dr
- 358 Bayou Blue Bypass Rd
- 201 Supercharge Dr
- 599 Jean Charles Blvd
- 605 Jean Charles Blvd
- 207 Chisholm Trail
- 207 Chisolm Trail
- 185 Chisholm Trail
- 0 Baja Trail Unit 105460
- 0 Baja Trail Unit 108705
- 0 Baja Trail Unit 110884
- Lot 22 Baja Trail
- Lot 21 Baja Trail
- Lot 45 Baja Trail
- lot 33 Baja Trail
- Lot 20 Baja Trail
- Lot 46 Baja Trail
- Lot 32 Baja Trail
- Lot 28 Baja Trail
- Lot 37 Baja Trail
- Lot 29 Baja Trail
- Lot 25 Baja Trail
- Lot 39 Baja Trail
- 0 Baja Trail Unit 116645
- Lot 26 Baja Trail