Estimated Value: $342,000 - $382,000
3
Beds
3
Baths
2,804
Sq Ft
$129/Sq Ft
Est. Value
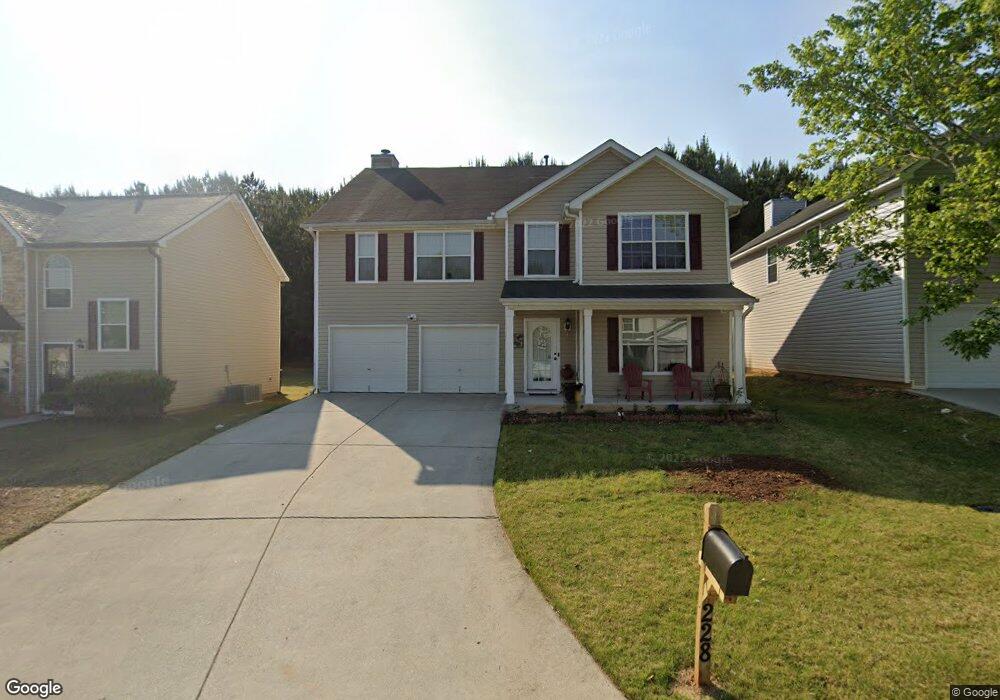
About This Home
This home is located at 228 Baywood Crossing, Hiram, GA 30141 and is currently estimated at $362,557, approximately $129 per square foot. 228 Baywood Crossing is a home located in Paulding County with nearby schools including Hiram Elementary School, P. B. Ritch Middle School, and Hiram High School.
Ownership History
Date
Name
Owned For
Owner Type
Purchase Details
Closed on
Sep 16, 2009
Sold by
Hud-Housing Of Urban Dev
Bought by
Vargas Ramiro
Current Estimated Value
Home Financials for this Owner
Home Financials are based on the most recent Mortgage that was taken out on this home.
Original Mortgage
$111,823
Outstanding Balance
$73,243
Interest Rate
5.22%
Mortgage Type
FHA
Estimated Equity
$289,314
Purchase Details
Closed on
Dec 2, 2008
Sold by
Flagstar Bk Fsb
Bought by
Hud-Housing Of Urban Dev
Purchase Details
Closed on
Apr 23, 2007
Sold by
Legacy Communities Of Ballenti
Bought by
Stephens Gerald and Stephens Barbara
Home Financials for this Owner
Home Financials are based on the most recent Mortgage that was taken out on this home.
Original Mortgage
$199,362
Interest Rate
6.1%
Mortgage Type
FHA
Create a Home Valuation Report for This Property
The Home Valuation Report is an in-depth analysis detailing your home's value as well as a comparison with similar homes in the area
Home Values in the Area
Average Home Value in this Area
Purchase History
| Date | Buyer | Sale Price | Title Company |
|---|---|---|---|
| Vargas Ramiro | -- | -- | |
| Hud-Housing Of Urban Dev | -- | -- | |
| Flagstar Bk Fsb | $207,421 | -- | |
| Stephens Gerald | $202,500 | -- |
Source: Public Records
Mortgage History
| Date | Status | Borrower | Loan Amount |
|---|---|---|---|
| Open | Vargas Ramiro | $111,823 | |
| Previous Owner | Stephens Gerald | $199,362 |
Source: Public Records
Tax History Compared to Growth
Tax History
| Year | Tax Paid | Tax Assessment Tax Assessment Total Assessment is a certain percentage of the fair market value that is determined by local assessors to be the total taxable value of land and additions on the property. | Land | Improvement |
|---|---|---|---|---|
| 2024 | $3,765 | $154,576 | $16,000 | $138,576 |
| 2023 | $3,997 | $155,836 | $16,000 | $139,836 |
| 2022 | $3,579 | $139,172 | $12,000 | $127,172 |
| 2021 | $2,976 | $104,288 | $8,000 | $96,288 |
| 2020 | $2,760 | $94,776 | $8,000 | $86,776 |
| 2019 | $2,677 | $90,712 | $8,000 | $82,712 |
| 2018 | $2,483 | $84,280 | $8,000 | $76,280 |
| 2017 | $2,276 | $76,368 | $8,000 | $68,368 |
| 2016 | $2,159 | $73,280 | $8,000 | $65,280 |
| 2015 | $2,025 | $67,640 | $8,000 | $59,640 |
| 2014 | $1,413 | $46,628 | $8,000 | $38,628 |
| 2013 | -- | $35,880 | $8,000 | $27,880 |
Source: Public Records
Map
Nearby Homes
- 273 Baywood Crossing
- 98 Baywood Way
- 143 Birch St
- 322 Lanier Ct
- 14 Berkten Ct
- 79 Kennedy Ct
- 2393 Bill Carruth Pkwy
- 194 Prospect Path
- 149 Willow Bend Rd
- 149 Willow Bend Dr
- 133 Willow Bend Dr
- 133 Willow Bend Rd
- 304 Greystone Pkwy
- 153 Oak St
- 585 Hiram Douglasville Hwy
- 209 Enterprise Path
- 146 Rosemont Ct
- 24 Darbys Run Way
- 9 Darbys Run Way
- 491 Hiram Douglasville Hwy
- 218 Baywood Crossing
- 238 Baywood Crossing
- 208 Baywood Crossing
- 248 Baywood Crossing
- 414 Baywood Way
- 424 Baywood Way
- 404 Baywood Way
- 198 Baywood Crossing
- 436 Baywood Way
- 388 Baywood Way
- 280 Baywood Crossing
- 219 Baywood Crossing
- 231 Baywood Crossing
- 241 Baywood Crossing
- 186 Baywood Crossing
- 446 Baywood Way
- 211 Baywood Crossing
- 211 Baywood Crossing Unit 103
- 378 Baywood Way
- 255 Baywood Crossing