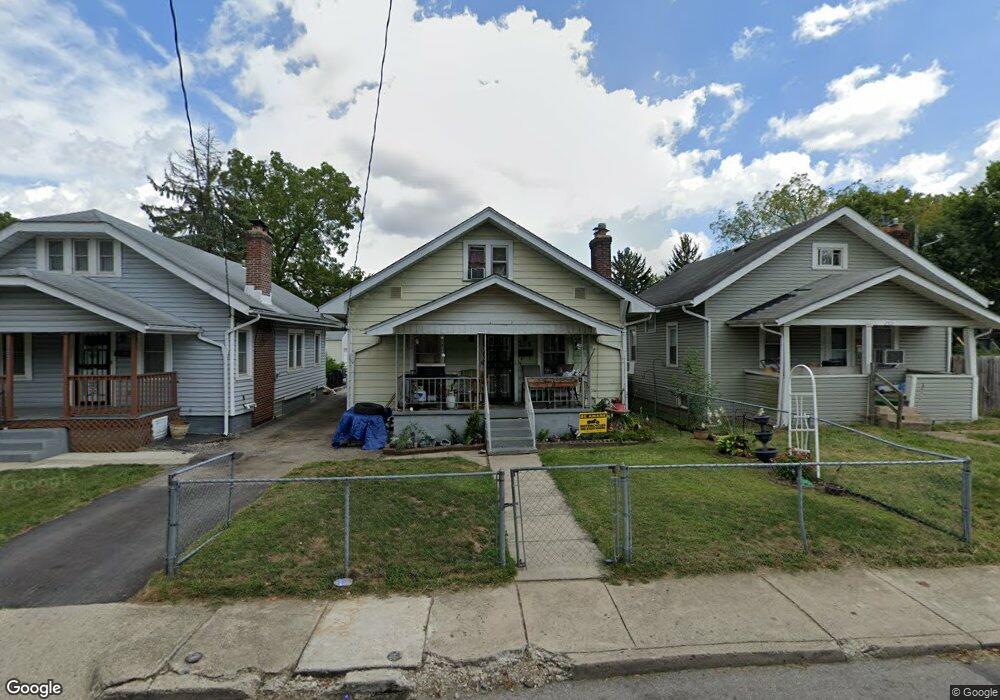
228 Belvidere Ave Columbus, OH 43223
Central Hilltop NeighborhoodEstimated Value: $125,000 - $162,062
3
Beds
1
Bath
1,404
Sq Ft
$105/Sq Ft
Est. Value
About This Home
This home is located at 228 Belvidere Ave, Columbus, OH 43223 and is currently estimated at $147,266, approximately $104 per square foot. 228 Belvidere Ave is a home located in Franklin County with nearby schools including Highland Elementary School, Westmoor Middle School, and West High School.
Ownership History
Date
Name
Owned For
Owner Type
Purchase Details
Closed on
Sep 21, 2023
Sold by
Jm Roberts Llc
Bought by
Roen Properties Llc
Current Estimated Value
Home Financials for this Owner
Home Financials are based on the most recent Mortgage that was taken out on this home.
Original Mortgage
$104,000
Outstanding Balance
$101,500
Interest Rate
7.18%
Mortgage Type
New Conventional
Estimated Equity
$45,766
Purchase Details
Closed on
Sep 10, 2021
Sold by
E Z Investment Property Llc
Bought by
Jm Roberts Enterprises Llc
Purchase Details
Closed on
Jul 27, 2021
Sold by
Colvin Willie and Lee Ethel Jane
Bought by
E Z Investment Property Llc
Purchase Details
Closed on
Jul 12, 2021
Sold by
Colvin Gravea Inez and Colvin Willie
Bought by
E Z Investment Property Llc
Purchase Details
Closed on
Apr 10, 2007
Sold by
Estate Of Ada B Colvin
Bought by
Young Colvin Willie and Young Lee Ethel Jane
Purchase Details
Closed on
Apr 13, 1988
Bought by
Colvin Ada B
Create a Home Valuation Report for This Property
The Home Valuation Report is an in-depth analysis detailing your home's value as well as a comparison with similar homes in the area
Home Values in the Area
Average Home Value in this Area
Purchase History
| Date | Buyer | Sale Price | Title Company |
|---|---|---|---|
| Roen Properties Llc | $50,000 | Empora Title | |
| Jm Roberts Enterprises Llc | $48,000 | Axxis Title Agency Ltd | |
| E Z Investment Property Llc | $45,000 | Axxis Title Agency Ltd | |
| E Z Investment Property Llc | -- | Axxis Title Agency Ltd | |
| Young Colvin Willie | -- | None Available | |
| Colvin Ada B | -- | -- |
Source: Public Records
Mortgage History
| Date | Status | Borrower | Loan Amount |
|---|---|---|---|
| Open | Roen Properties Llc | $104,000 |
Source: Public Records
Tax History
| Year | Tax Paid | Tax Assessment Tax Assessment Total Assessment is a certain percentage of the fair market value that is determined by local assessors to be the total taxable value of land and additions on the property. | Land | Improvement |
|---|---|---|---|---|
| 2025 | $1,671 | $33,190 | $4,170 | $29,020 |
| 2024 | $1,671 | $33,190 | $4,170 | $29,020 |
| 2023 | $1,502 | $33,190 | $4,170 | $29,020 |
| 2022 | $832 | $15,650 | $1,820 | $13,830 |
| 2021 | $359 | $15,650 | $1,820 | $13,830 |
| 2020 | $359 | $15,650 | $1,820 | $13,830 |
| 2019 | $230 | $12,540 | $1,510 | $11,030 |
| 2018 | $258 | $12,540 | $1,510 | $11,030 |
| 2017 | $292 | $12,540 | $1,510 | $11,030 |
| 2016 | $354 | $13,510 | $3,500 | $10,010 |
| 2015 | $286 | $13,510 | $3,500 | $10,010 |
| 2014 | $287 | $13,510 | $3,500 | $10,010 |
| 2013 | $213 | $15,925 | $4,130 | $11,795 |
Source: Public Records
Map
Nearby Homes
- 265-267 Belvidere Ave
- 196 Belvidere Ave
- 178 Belvidere Ave
- 172 Whitethorne Ave
- 249 Midland Ave
- 329-331 Whitethorne Ave
- 244 Clarendon Ave
- 83 Belvidere Ave
- 107 Midland Ave Unit 107-109
- 264 Nashoba Ave
- 137 Clarendon Ave
- 247 Columbian Ave
- 83 Lechner Ave
- 45 Belvidere Ave
- 302 S Highland Ave Unit 306
- 2023 Sullivant Ave Unit 2025
- 151 Columbian Ave
- 225 S Highland Ave
- 2009 Sullivant Ave Unit 9
- 1936 Floral Ave
- 222 Belvidere Ave
- 232 Belvidere Ave
- 218 Belvidere Ave
- 2038 Doren Ave
- 2038 Doren Ave
- 210 Belvidere Ave
- 244 Belvidere Ave
- 2041 Doren Ave
- 206 Belvidere Ave
- 248 Belvidere Ave
- 2028 Doren Ave
- 204 Belvidere Ave
- 252 Belvidere Ave
- 2022 Doren Ave
- 223 Belvidere Ave
- 245 Wrexham Ave
- 235 Belvidere Ave
- 219 Belvidere Ave
- 256 Belvidere Ave
- 0 Wrexham Ave
Your Personal Tour Guide
Ask me questions while you tour the home.