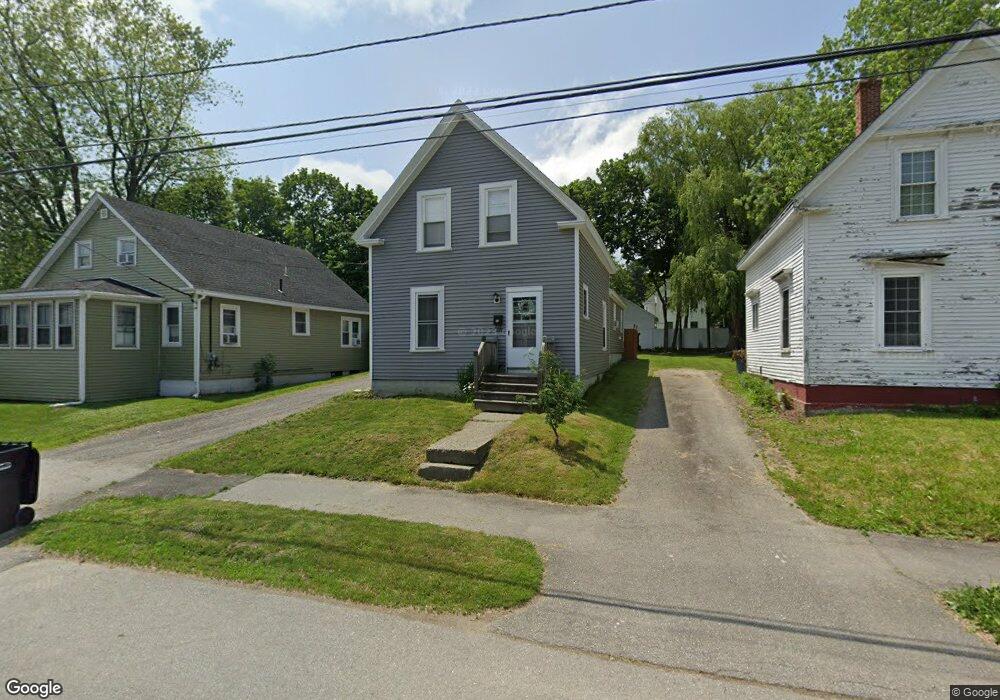
228 Birch St Bangor, ME 04401
Tree Streets NeighborhoodEstimated Value: $224,745 - $274,000
3
Beds
1
Bath
1,294
Sq Ft
$199/Sq Ft
Est. Value
About This Home
This home is located at 228 Birch St, Bangor, ME 04401 and is currently estimated at $257,686, approximately $199 per square foot. 228 Birch St is a home located in Penobscot County with nearby schools including Fruit Street School, Mary Snow School, and William S. Cohen School.
Ownership History
Date
Name
Owned For
Owner Type
Purchase Details
Closed on
Sep 15, 2022
Sold by
King Nancy R
Bought by
King Jennifer L
Current Estimated Value
Home Financials for this Owner
Home Financials are based on the most recent Mortgage that was taken out on this home.
Original Mortgage
$80,000
Outstanding Balance
$76,412
Interest Rate
5.22%
Mortgage Type
Purchase Money Mortgage
Estimated Equity
$181,274
Purchase Details
Closed on
Sep 7, 2016
Sold by
King Nancy R
Bought by
King Jennifer L
Create a Home Valuation Report for This Property
The Home Valuation Report is an in-depth analysis detailing your home's value as well as a comparison with similar homes in the area
Home Values in the Area
Average Home Value in this Area
Purchase History
| Date | Buyer | Sale Price | Title Company |
|---|---|---|---|
| King Jennifer L | -- | Liberty Title | |
| King Jennifer L | -- | -- |
Source: Public Records
Mortgage History
| Date | Status | Borrower | Loan Amount |
|---|---|---|---|
| Open | King Jennifer L | $80,000 |
Source: Public Records
Tax History Compared to Growth
Tax History
| Year | Tax Paid | Tax Assessment Tax Assessment Total Assessment is a certain percentage of the fair market value that is determined by local assessors to be the total taxable value of land and additions on the property. | Land | Improvement |
|---|---|---|---|---|
| 2024 | $2,577 | $138,900 | $15,400 | $123,500 |
| 2023 | $2,332 | $121,800 | $14,800 | $107,000 |
| 2022 | $2,162 | $106,000 | $14,800 | $91,200 |
| 2021 | $2,016 | $90,400 | $13,700 | $76,700 |
| 2020 | $2,014 | $86,800 | $13,500 | $73,300 |
| 2019 | $1,932 | $84,000 | $13,500 | $70,500 |
| 2018 | $1,886 | $82,200 | $13,500 | $68,700 |
| 2017 | $1,788 | $79,300 | $13,500 | $65,800 |
| 2016 | $1,746 | $77,600 | $13,500 | $64,100 |
| 2015 | $1,703 | $77,600 | $13,500 | $64,100 |
| 2014 | $1,690 | $77,500 | $13,500 | $64,000 |
| 2013 | $1,668 | $80,200 | $13,500 | $66,700 |
Source: Public Records
Map
Nearby Homes