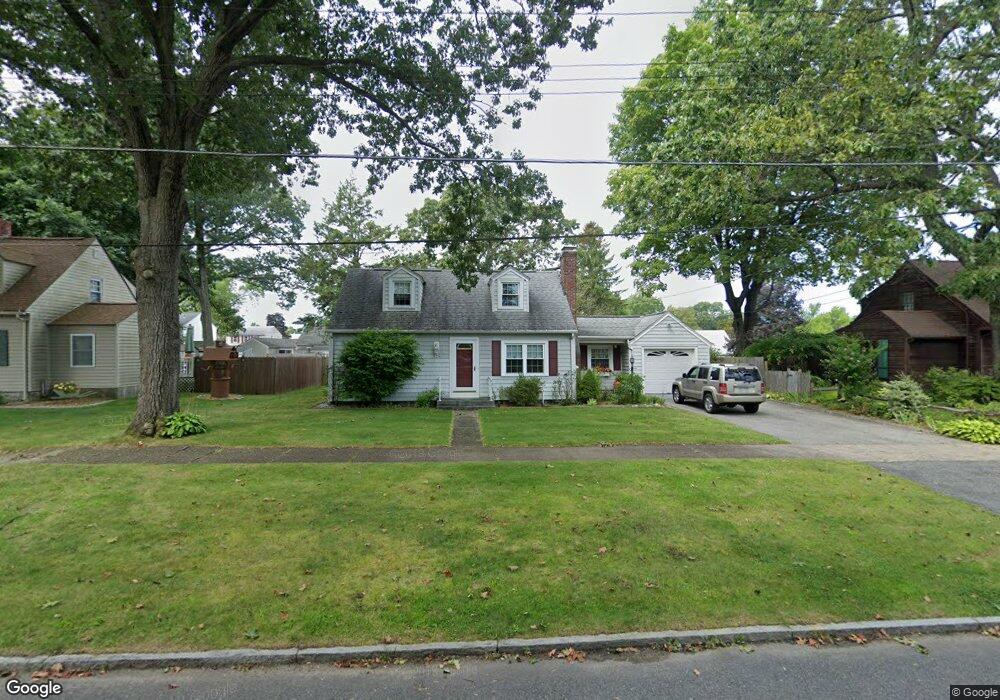
228 Bowles Park Springfield, MA 01104
East Springfield NeighborhoodEstimated Value: $327,000 - $368,000
3
Beds
3
Baths
1,397
Sq Ft
$242/Sq Ft
Est. Value
About This Home
This home is located at 228 Bowles Park, Springfield, MA 01104 and is currently estimated at $337,552, approximately $241 per square foot. 228 Bowles Park is a home located in Hampden County with nearby schools including Van Sickle Academy, Springfield Central High School, and Roger L. Putnam Vocational Technical Academy.
Ownership History
Date
Name
Owned For
Owner Type
Purchase Details
Closed on
Apr 8, 2024
Sold by
Lambert Amy C
Bought by
Lambert Amy C and Lambert Christopher J
Current Estimated Value
Purchase Details
Closed on
May 26, 2022
Sold by
Rawle Nancy J Est and Lambert
Bought by
Lambert Amy C
Purchase Details
Closed on
May 15, 2002
Sold by
Blais Richard P and Blais Sandra L
Bought by
Rawle Richard S and Rawle Nancy J
Home Financials for this Owner
Home Financials are based on the most recent Mortgage that was taken out on this home.
Original Mortgage
$100,000
Interest Rate
7.15%
Mortgage Type
Purchase Money Mortgage
Purchase Details
Closed on
Oct 16, 1989
Sold by
Belisle Jean G
Bought by
Blais Richard P
Create a Home Valuation Report for This Property
The Home Valuation Report is an in-depth analysis detailing your home's value as well as a comparison with similar homes in the area
Home Values in the Area
Average Home Value in this Area
Purchase History
| Date | Buyer | Sale Price | Title Company |
|---|---|---|---|
| Lambert Amy C | -- | None Available | |
| Lambert Amy C | -- | None Available | |
| Lambert Amy C | -- | None Available | |
| Lambert Amy C | -- | None Available | |
| Rawle Richard S | $129,000 | -- | |
| Rawle Richard S | $129,000 | -- | |
| Blais Richard P | $129,000 | -- | |
| Blais Richard P | $129,000 | -- |
Source: Public Records
Mortgage History
| Date | Status | Borrower | Loan Amount |
|---|---|---|---|
| Previous Owner | Blais Richard P | $60,900 | |
| Previous Owner | Blais Richard P | $100,000 |
Source: Public Records
Tax History
| Year | Tax Paid | Tax Assessment Tax Assessment Total Assessment is a certain percentage of the fair market value that is determined by local assessors to be the total taxable value of land and additions on the property. | Land | Improvement |
|---|---|---|---|---|
| 2025 | $5,051 | $322,100 | $39,600 | $282,500 |
| 2024 | $4,794 | $298,500 | $39,600 | $258,900 |
| 2023 | $4,411 | $258,700 | $36,900 | $221,800 |
| 2022 | $4,242 | $225,400 | $34,500 | $190,900 |
| 2021 | $4,115 | $217,700 | $31,400 | $186,300 |
| 2020 | $3,898 | $199,600 | $31,400 | $168,200 |
| 2019 | $3,344 | $169,900 | $32,400 | $137,500 |
| 2018 | $3,373 | $171,400 | $32,400 | $139,000 |
| 2017 | $3,262 | $165,900 | $29,300 | $136,600 |
| 2016 | $3,077 | $156,500 | $29,300 | $127,200 |
| 2015 | $3,078 | $156,500 | $29,300 | $127,200 |
Source: Public Records
Map
Nearby Homes
- 147 Bowles Park
- 225 Osborne Terrace
- 1730 Carew St
- 66 Thornton St
- 70 Chateaugay St
- 104 Chateaugay St
- 105 Lachine St
- 112 W Canton Cir
- 181 Beauchamp Terrace
- 114 Monrovia St
- 58 Eureka St
- 152 Monrovia St
- 158 Monrovia St
- 200 El Paso St
- 30 Butler Ave
- 1128 Page Blvd
- 191 Monrovia St
- 101 Huntington Ave
- 3 Fordham St
- 104 Madison St
- 220 Bowles Park
- 234 Bowles Park
- 73 Bessemer St
- 81 Bessemer St
- 65 Bessemer St
- 212 Bowles Park
- 242 Bowles Park
- 87 Bessemer St
- 57 Bessemer St
- 239 Bowles Park
- 206 Bowles Park
- 229 Bowles Park
- 48 Anniversary St
- 249 Bowles Park
- 95 Bessemer St
- 65 Beaufort Cir
- 49 Bessemer St
- 219 Bowles Park
- 64 Bessemer St
- 68 Beaufort Cir
Your Personal Tour Guide
Ask me questions while you tour the home.