228 Brayton Point Rd Westport, MA 02790
Acoaxet NeighborhoodEstimated Value: $1,131,000 - $1,447,000
2
Beds
--
Bath
1,326
Sq Ft
$984/Sq Ft
Est. Value
About This Home
This home is located at 228 Brayton Point Rd, Westport, MA 02790 and is currently estimated at $1,304,434, approximately $983 per square foot. 228 Brayton Point Rd is a home located in Bristol County with nearby schools including Alice A. Macomber Primary School, Westport Elementary School, and Westport Middle-High School.
Ownership History
Date
Name
Owned For
Owner Type
Purchase Details
Closed on
Jul 21, 2022
Sold by
Nielsen Debra C and Nielsen Rolf
Bought by
Debra C Nielsen T
Current Estimated Value
Purchase Details
Closed on
May 20, 2021
Sold by
Burton Charles F and Gardiner Colleen M
Bought by
Gardiner Fenwick G and Nelson Rolf
Purchase Details
Closed on
May 19, 2021
Sold by
Dorothea F Mello T
Bought by
Gardiner Colleen M and Gardiner Fenwick J
Purchase Details
Closed on
May 18, 2021
Sold by
Mcnally Alfred I and Mcnally Colette D
Bought by
Gardiner Colleen M and Gardiner Fenwick J
Purchase Details
Closed on
Jul 10, 2019
Sold by
Mcnally Alfred I
Bought by
Mcnally Alfred I and Mcnally Colette D
Purchase Details
Closed on
Aug 24, 2015
Sold by
Burton Constance A
Bought by
Burton Charles F
Purchase Details
Closed on
Jan 9, 2013
Sold by
Desmarais Helen C
Bought by
Desmarais Ft
Create a Home Valuation Report for This Property
The Home Valuation Report is an in-depth analysis detailing your home's value as well as a comparison with similar homes in the area
Home Values in the Area
Average Home Value in this Area
Purchase History
| Date | Buyer | Sale Price | Title Company |
|---|---|---|---|
| Debra C Nielsen T | -- | None Available | |
| Gardiner Fenwick G | $293,750 | None Available | |
| Gardiner Colleen M | $293,750 | None Available | |
| Gardiner Colleen M | $293,750 | None Available | |
| Mcnally Alfred I | -- | -- | |
| Burton Charles F | -- | -- | |
| Desmarais Ft | -- | -- |
Source: Public Records
Tax History Compared to Growth
Tax History
| Year | Tax Paid | Tax Assessment Tax Assessment Total Assessment is a certain percentage of the fair market value that is determined by local assessors to be the total taxable value of land and additions on the property. | Land | Improvement |
|---|---|---|---|---|
| 2025 | $7,828 | $1,050,800 | $920,500 | $130,300 |
| 2024 | $7,578 | $980,400 | $852,800 | $127,600 |
| 2023 | $7,608 | $932,400 | $812,200 | $120,200 |
| 2022 | $9,816 | $1,157,500 | $1,050,900 | $106,600 |
| 2021 | $9,329 | $1,082,300 | $978,000 | $104,300 |
| 2020 | $8,818 | $1,046,000 | $941,700 | $104,300 |
| 2019 | $8,591 | $1,038,800 | $941,700 | $97,100 |
| 2018 | $7,467 | $913,900 | $839,400 | $74,500 |
| 2017 | $7,199 | $903,300 | $827,700 | $75,600 |
| 2016 | $7,145 | $903,300 | $827,700 | $75,600 |
| 2015 | $7,139 | $900,300 | $827,700 | $72,600 |
Source: Public Records
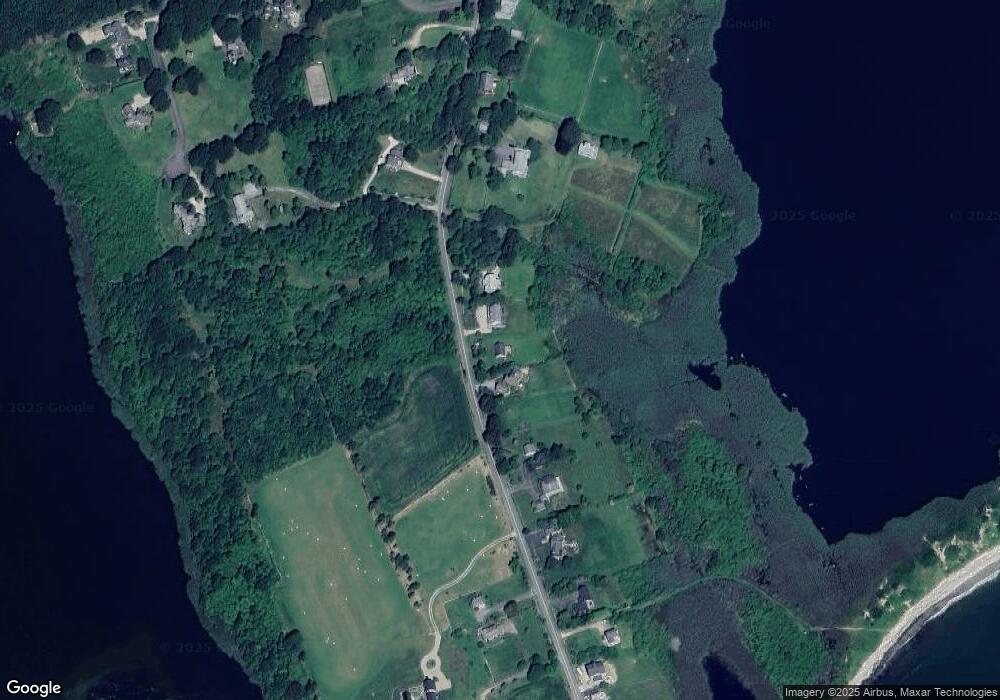
Map
Nearby Homes
- 189 Brayton Point Rd
- 304 Brayton Point Rd
- 19 Seabury Ln
- 18 Old Barn Rd
- 255 John Dyer Rd
- 128 Maple Ave
- 141 S Of Commons Rd
- 505 Long Hwy
- 245 John Dyer Rd
- 1881 Main Rd
- 1749 Main Rd
- 0 Willow Ave
- 1580 Main Rd
- 576 W Main Rd
- 1702J Drift Rd
- 1702 Drift Rd
- 536 W Main Rd
- 116 Amy Hart Path
- 17 Quail Trail
- 1346 Main Rd Unit B
- 234 Brayton Point Rd
- 222 Brayton Point Rd
- 238 Brayton Point Rd
- 192 Brayton Point Rd
- 209 Brayton Point Rd
- 248 Brayton Point Rd
- 194 Brayton Point Rd
- 258 Brayton Point Rd
- 205 Brayton Point Rd
- 190 Brayton Point Rd
- 186 Brayton Point Rd
- 270 Brayton Point Rd
- 183 Brayton Point Rd
- 21 Brayton Point Rd
- 272 Brayton Point Rd
- 278 Brayton Point Rd
- 180 Brayton Point Rd
- 284 Brayton Point Rd
- 22 Ellsworth Dr
- 1 Ellsworth Dr