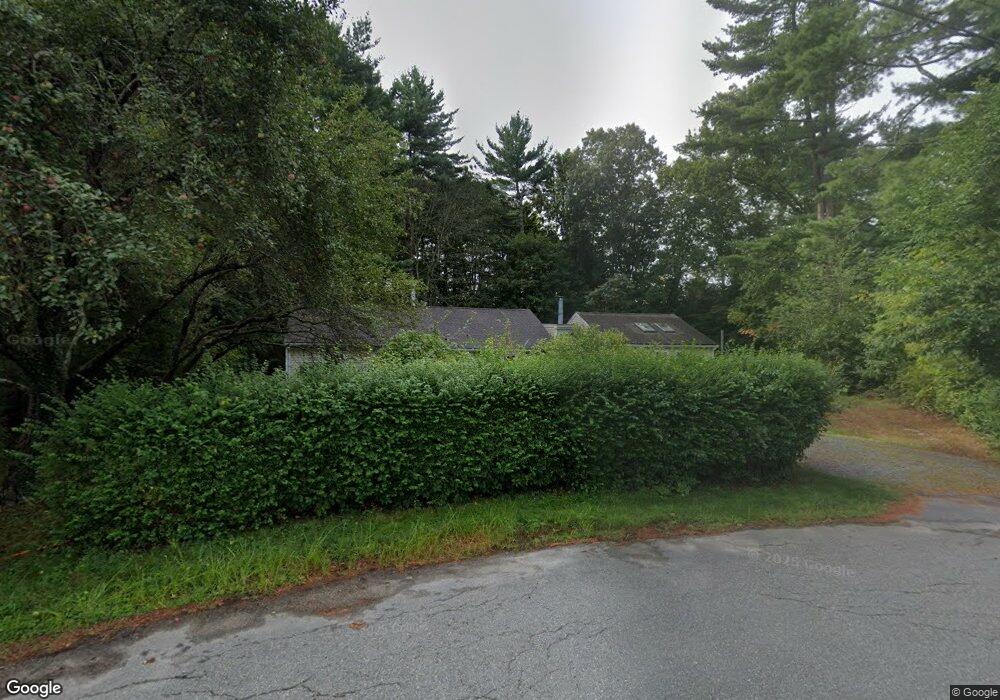
228 Brook Cir Hanover, MA 02339
Estimated Value: $611,000 - $735,000
3
Beds
2
Baths
1,853
Sq Ft
$347/Sq Ft
Est. Value
About This Home
This home is located at 228 Brook Cir, Hanover, MA 02339 and is currently estimated at $643,734, approximately $347 per square foot. 228 Brook Cir is a home located in Plymouth County with nearby schools including Hanover High School and Calvary Chapel Academy.
Ownership History
Date
Name
Owned For
Owner Type
Purchase Details
Closed on
Dec 13, 2018
Sold by
Toto Anthony J and Hynek Roxane
Bought by
Hynek-Toto Ft and Toto
Current Estimated Value
Purchase Details
Closed on
Nov 10, 1983
Bought by
Toto Anthony J and Hynek Roxane
Create a Home Valuation Report for This Property
The Home Valuation Report is an in-depth analysis detailing your home's value as well as a comparison with similar homes in the area
Home Values in the Area
Average Home Value in this Area
Purchase History
| Date | Buyer | Sale Price | Title Company |
|---|---|---|---|
| Hynek-Toto Ft | -- | -- | |
| Hynek-Toto Ft | -- | -- | |
| Toto Anthony J | -- | -- |
Source: Public Records
Mortgage History
| Date | Status | Borrower | Loan Amount |
|---|---|---|---|
| Previous Owner | Toto Anthony J | $100,000 | |
| Previous Owner | Toto Anthony J | $73,000 | |
| Previous Owner | Toto Anthony J | $84,750 |
Source: Public Records
Tax History
| Year | Tax Paid | Tax Assessment Tax Assessment Total Assessment is a certain percentage of the fair market value that is determined by local assessors to be the total taxable value of land and additions on the property. | Land | Improvement |
|---|---|---|---|---|
| 2025 | $6,093 | $493,400 | $211,600 | $281,800 |
| 2024 | $6,335 | $493,400 | $211,600 | $281,800 |
| 2023 | $6,122 | $453,800 | $192,400 | $261,400 |
| 2022 | $6,381 | $418,400 | $216,400 | $202,000 |
| 2021 | $6,246 | $382,500 | $185,800 | $196,700 |
| 2020 | $5,974 | $366,300 | $174,900 | $191,400 |
| 2019 | $5,307 | $323,400 | $153,100 | $170,300 |
| 2018 | $5,493 | $337,400 | $170,500 | $166,900 |
| 2017 | $5,156 | $312,100 | $160,200 | $151,900 |
| 2016 | $5,262 | $312,100 | $160,200 | $151,900 |
| 2015 | $4,758 | $294,600 | $160,200 | $134,400 |
Source: Public Records
Map
Nearby Homes
Your Personal Tour Guide
Ask me questions while you tour the home.