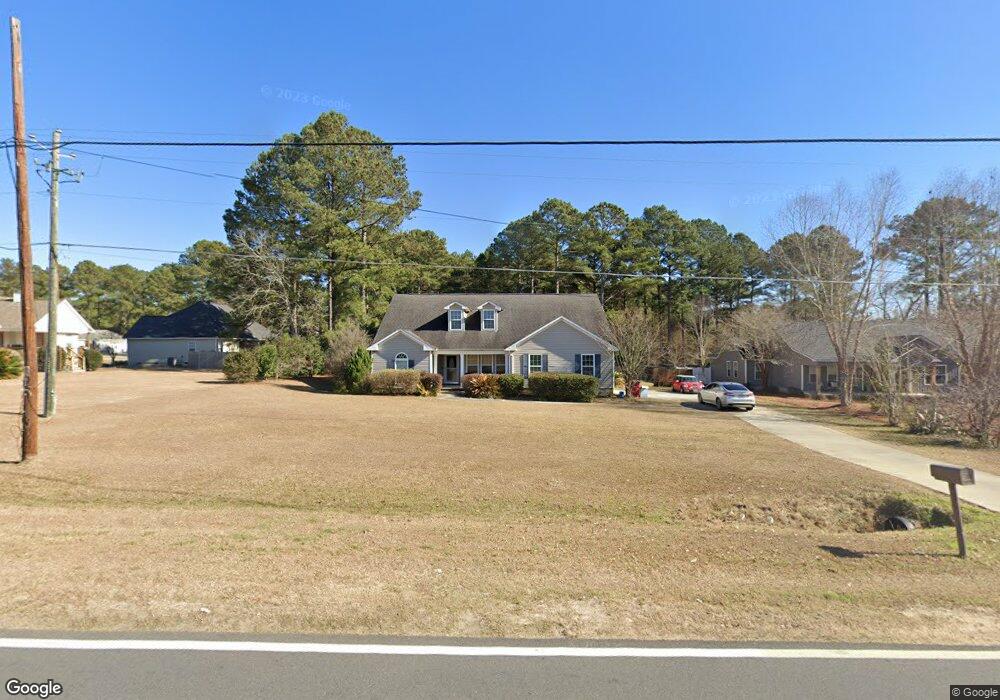
228 Carpenter Rd N Tifton, GA 31793
Estimated Value: $253,000 - $301,000
3
Beds
2
Baths
1,911
Sq Ft
$144/Sq Ft
Est. Value
About This Home
This home is located at 228 Carpenter Rd N, Tifton, GA 31793 and is currently estimated at $274,491, approximately $143 per square foot. 228 Carpenter Rd N is a home located in Tift County with nearby schools including Len Lastinger Primary School, Matt Wilson Elementary School, and J.T. Reddick School.
Ownership History
Date
Name
Owned For
Owner Type
Purchase Details
Closed on
Jun 23, 2010
Sold by
Headwind Development Llc
Bought by
Mcgriff Anthony B
Current Estimated Value
Home Financials for this Owner
Home Financials are based on the most recent Mortgage that was taken out on this home.
Original Mortgage
$160,000
Interest Rate
4.77%
Mortgage Type
New Conventional
Purchase Details
Closed on
Sep 25, 2009
Sold by
Us Bank National Association
Bought by
Headwind Development Llc
Purchase Details
Closed on
Jun 2, 2009
Sold by
Bateman Terry
Bought by
Us Bank National Association
Purchase Details
Closed on
Dec 28, 2006
Sold by
Tri W Enterprises Inc
Bought by
Bateman Terry and Bateman Angela Denise
Home Financials for this Owner
Home Financials are based on the most recent Mortgage that was taken out on this home.
Original Mortgage
$37,100
Interest Rate
6.06%
Mortgage Type
New Conventional
Purchase Details
Closed on
Feb 9, 2004
Bought by
Sumner Properties Llc
Create a Home Valuation Report for This Property
The Home Valuation Report is an in-depth analysis detailing your home's value as well as a comparison with similar homes in the area
Home Values in the Area
Average Home Value in this Area
Purchase History
| Date | Buyer | Sale Price | Title Company |
|---|---|---|---|
| Mcgriff Anthony B | $160,000 | -- | |
| Headwind Development Llc | $121,000 | -- | |
| Us Bank National Association | $131,750 | -- | |
| Bateman Terry | $185,500 | -- | |
| Sumner Properties Llc | -- | -- |
Source: Public Records
Mortgage History
| Date | Status | Borrower | Loan Amount |
|---|---|---|---|
| Closed | Mcgriff Anthony B | $160,000 | |
| Previous Owner | Bateman Terry | $37,100 | |
| Previous Owner | Bateman Terry | $148,400 |
Source: Public Records
Tax History Compared to Growth
Tax History
| Year | Tax Paid | Tax Assessment Tax Assessment Total Assessment is a certain percentage of the fair market value that is determined by local assessors to be the total taxable value of land and additions on the property. | Land | Improvement |
|---|---|---|---|---|
| 2024 | -- | $107,906 | $7,400 | $100,506 |
| 2023 | $0 | $75,422 | $9,200 | $66,222 |
| 2022 | $2,838 | $75,422 | $9,200 | $66,222 |
| 2021 | $2,712 | $71,610 | $9,200 | $62,410 |
| 2020 | $2,706 | $67,799 | $9,200 | $58,599 |
| 2019 | $2,706 | $67,799 | $9,200 | $58,599 |
| 2018 | $0 | $67,799 | $9,200 | $58,599 |
| 2017 | $0 | $67,799 | $9,200 | $58,599 |
| 2016 | $2,548 | $67,799 | $9,200 | $58,599 |
| 2015 | $2,551 | $67,799 | $9,200 | $58,599 |
| 2014 | $2,712 | $67,799 | $9,200 | $58,599 |
| 2013 | -- | $67,798 | $9,200 | $58,598 |
Source: Public Records
Map
Nearby Homes
- 0 Carpenter Rd N
- W Hutchinson Rd
- Tract 2 Whiddon Mill Rd
- Tract 1 Whiddon Mill Rd
- 0 W Hutchinson Rd
- 1607 Mallard Ln
- 100 Elizabeth Dr
- 1901 Melba Dr
- 0 US Highway 41 Unit 137727
- 0 N U S Hwy 41
- 78 Chase Cir
- 26 Alan Ln
- 31 Henry Way
- 1808 Rutland Rd
- 307 Fulwood Blvd
- 7 Deborah Dr
- 2609 Emmett Dr
- 2202 Emory Dr
- 225 Alabama Dr
- 4620 Murray Ave
- 224 Carpenter Rd N
- 106 Cambridge Ct
- 102 Cambridge Ct
- 110 Cambridge Ct
- 220 Carpenter Rd N
- 114 Cambridge Ct
- 216 Carpenter Rd N
- 102 Ansley Ave
- 101 Ansley Ave
- 118 Cambridge Ct
- 106 Ansley Ave
- 125 Cambridge Ct
- 105 Ansley Ave
- 125 Cambrigde Ct
- 122 Cambridge Ct
- 133 Cambridge Ct
- 110 Ansley Ave
- 109 Ansley Ave
- 126 Cambridge Ct
- 137 Cambridge Ct