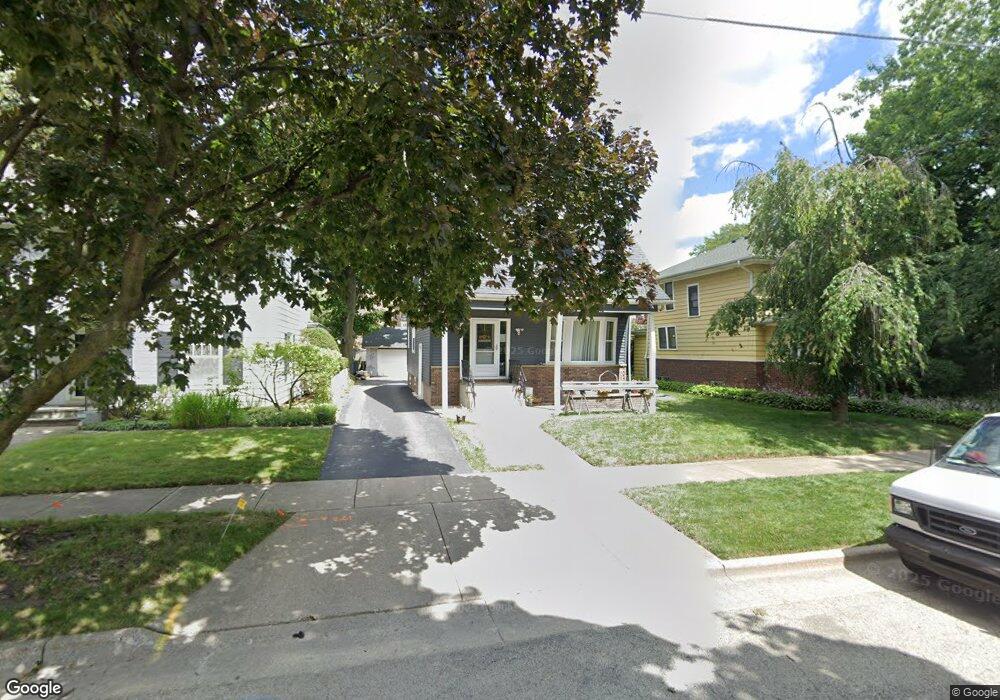
228 Douglas Ave Waukegan, IL 60085
Estimated Value: $258,000 - $265,000
4
Beds
2
Baths
1,512
Sq Ft
$173/Sq Ft
Est. Value
About This Home
This home is located at 228 Douglas Ave, Waukegan, IL 60085 and is currently estimated at $261,417, approximately $172 per square foot. 228 Douglas Ave is a home located in Lake County with nearby schools including Greenwood Elementary School, Edith M Smith Middle School, and Waukegan High School.
Ownership History
Date
Name
Owned For
Owner Type
Purchase Details
Closed on
Jan 10, 2006
Sold by
Murphy Kimberly J
Bought by
Gonzales Timothy J and Murphy Gonzales Kimberly J
Current Estimated Value
Home Financials for this Owner
Home Financials are based on the most recent Mortgage that was taken out on this home.
Original Mortgage
$132,000
Outstanding Balance
$85,506
Interest Rate
8.99%
Mortgage Type
New Conventional
Estimated Equity
$175,911
Purchase Details
Closed on
Dec 18, 2003
Sold by
Millennium Trust Llc
Bought by
910 Burnett Llc
Purchase Details
Closed on
Aug 10, 1999
Sold by
Coggins Jeffrey D and Coggins Susan R
Bought by
Nieto Anthony J and Nieto Julie J
Purchase Details
Closed on
Aug 9, 1999
Sold by
Lasalle Bank National Assn
Bought by
Cole Taylor Bank
Purchase Details
Closed on
Apr 13, 1998
Sold by
Heiny Pamela
Bought by
Murphy Kimberly J
Create a Home Valuation Report for This Property
The Home Valuation Report is an in-depth analysis detailing your home's value as well as a comparison with similar homes in the area
Home Values in the Area
Average Home Value in this Area
Purchase History
| Date | Buyer | Sale Price | Title Company |
|---|---|---|---|
| Gonzales Timothy J | -- | Tristar Title Llc | |
| 910 Burnett Llc | -- | -- | |
| Nieto Anthony J | $102,500 | Chicago Title Insurance Co | |
| Cole Taylor Bank | $200,000 | -- | |
| Murphy Kimberly J | -- | -- | |
| Heiny Pamela | -- | -- |
Source: Public Records
Mortgage History
| Date | Status | Borrower | Loan Amount |
|---|---|---|---|
| Open | Gonzales Timothy J | $132,000 |
Source: Public Records
Tax History Compared to Growth
Tax History
| Year | Tax Paid | Tax Assessment Tax Assessment Total Assessment is a certain percentage of the fair market value that is determined by local assessors to be the total taxable value of land and additions on the property. | Land | Improvement |
|---|---|---|---|---|
| 2024 | $4,639 | $63,494 | $9,418 | $54,076 |
| 2023 | $4,938 | $57,201 | $8,432 | $48,769 |
| 2022 | $4,938 | $56,508 | $7,933 | $48,575 |
| 2021 | $4,428 | $48,468 | $7,077 | $41,391 |
| 2020 | $4,438 | $45,154 | $6,593 | $38,561 |
| 2019 | $4,414 | $41,376 | $6,041 | $35,335 |
| 2018 | $3,919 | $36,695 | $6,997 | $29,698 |
| 2017 | $3,764 | $32,464 | $6,190 | $26,274 |
| 2016 | $3,432 | $28,210 | $5,379 | $22,831 |
| 2015 | $3,251 | $25,248 | $4,814 | $20,434 |
| 2014 | $3,643 | $27,069 | $6,069 | $21,000 |
| 2012 | $4,735 | $29,328 | $6,576 | $22,752 |
Source: Public Records
Map
Nearby Homes
- 415 W Ridgeland Ave
- 1122 N Ash St
- 1110 N Ash St
- 1336 N Ash St
- 723 N County St
- 1335 Chestnut St
- 1613 North Ave
- 918 N Ash St
- 325 4th St
- 616 W Keith Ave
- 611 N Genesee St
- 620 N Poplar St
- 1312 N Linden Ave
- 702 Franklin St
- 1105 Woodlawn Cir
- 917 N Linden Ave
- 1018 W Atlantic Ave
- 452 North Ave
- 522 N Poplar St
- 1109 Massena Ave
- 234 Douglas Ave
- 226 Douglas Ave
- 224 Douglas Ave
- 308 Douglas Ave
- 227 Douglas Ave
- 225 Douglas Ave
- 310 Douglas Ave
- 214 Douglas Ave
- 1212 N Sheridan Rd
- 303 Douglas Ave
- 312 Douglas Ave
- 215 Douglas Ave
- 1121 Douglas Ct
- 314 Douglas Ave
- 311 Douglas Ave
- 1202 N Sheridan Rd
- 1117 Douglas Ct
- 1122 Douglas Ct
- 1130 N Sheridan Rd
- 318 Douglas Ave