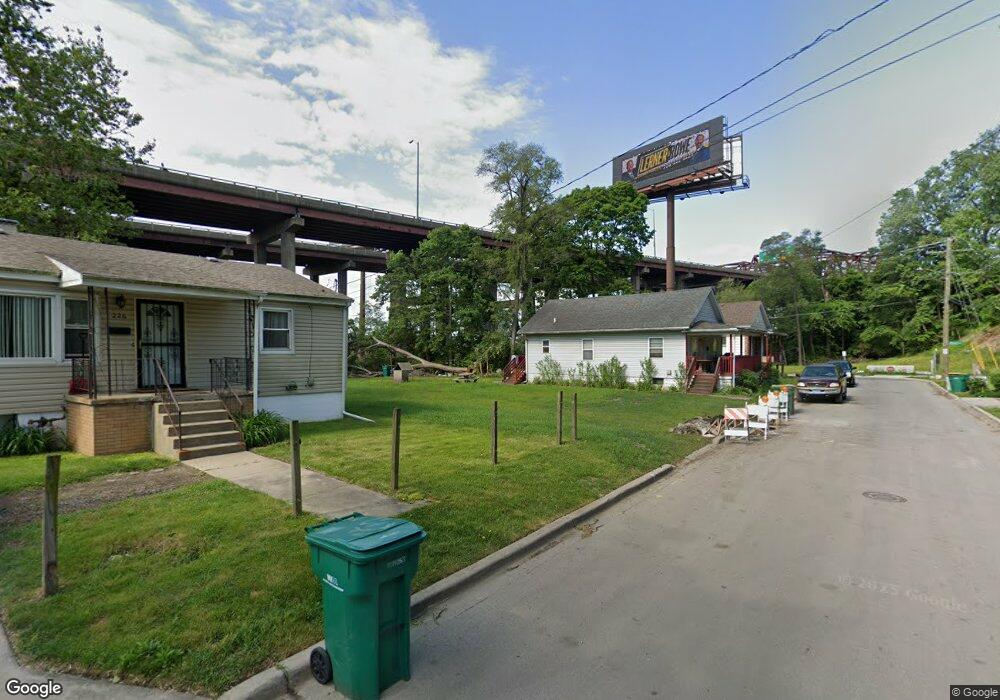
228 Duncan St Joliet, IL 60436
Southside Joliet NeighborhoodEstimated Value: $91,000 - $118,000
2
Beds
1
Bath
788
Sq Ft
$137/Sq Ft
Est. Value
About This Home
This home is located at 228 Duncan St, Joliet, IL 60436 and is currently estimated at $107,713, approximately $136 per square foot. 228 Duncan St is a home located in Will County with nearby schools including Farragut Elementary School, Dirksen Junior High School, and Joliet West High School.
Ownership History
Date
Name
Owned For
Owner Type
Purchase Details
Closed on
Dec 4, 2023
Sold by
Jfs Properties Llc
Bought by
People Of The State Of Illinois Department Of
Current Estimated Value
Purchase Details
Closed on
Jun 14, 2010
Sold by
Frazier Mildred
Bought by
Federal National Mortgage Association
Purchase Details
Closed on
Jun 11, 2010
Sold by
Fannie Mae
Bought by
Jfs Properties Llc
Purchase Details
Closed on
Dec 16, 2009
Sold by
Frazier Mildred
Bought by
Central Mortgage Company
Purchase Details
Closed on
Oct 24, 2000
Sold by
Edwards Macio S
Bought by
Frazier Mildred
Home Financials for this Owner
Home Financials are based on the most recent Mortgage that was taken out on this home.
Original Mortgage
$51,300
Interest Rate
7.96%
Purchase Details
Closed on
Nov 29, 1999
Sold by
Bennett Perry and Bennett Shirley T
Bought by
Edwards Macio S
Create a Home Valuation Report for This Property
The Home Valuation Report is an in-depth analysis detailing your home's value as well as a comparison with similar homes in the area
Home Values in the Area
Average Home Value in this Area
Purchase History
| Date | Buyer | Sale Price | Title Company |
|---|---|---|---|
| People Of The State Of Illinois Department Of | $90,000 | Wheatland Title | |
| Federal National Mortgage Association | -- | Attorneys Title Guaranty Fun | |
| Jfs Properties Llc | $12,500 | Attorneys Title Guaranty Fun | |
| Central Mortgage Company | $64,079 | None Available | |
| Frazier Mildred | $54,000 | -- | |
| Edwards Macio S | $16,500 | -- |
Source: Public Records
Mortgage History
| Date | Status | Borrower | Loan Amount |
|---|---|---|---|
| Previous Owner | Frazier Mildred | $51,300 |
Source: Public Records
Tax History Compared to Growth
Tax History
| Year | Tax Paid | Tax Assessment Tax Assessment Total Assessment is a certain percentage of the fair market value that is determined by local assessors to be the total taxable value of land and additions on the property. | Land | Improvement |
|---|---|---|---|---|
| 2024 | $2,493 | $29,762 | $3,451 | $26,311 |
| 2023 | $2,493 | $26,443 | $3,066 | $23,377 |
| 2022 | $2,209 | $23,919 | $2,773 | $21,146 |
| 2021 | $2,100 | $22,340 | $2,590 | $19,750 |
| 2020 | $1,992 | $21,216 | $2,460 | $18,756 |
| 2019 | $1,895 | $19,717 | $2,286 | $17,431 |
| 2018 | $1,815 | $18,219 | $2,112 | $16,107 |
| 2017 | $1,711 | $16,564 | $1,920 | $14,644 |
| 2016 | $1,639 | $15,251 | $1,760 | $13,491 |
| 2015 | $1,583 | $14,300 | $1,650 | $12,650 |
| 2014 | $1,583 | $14,250 | $1,650 | $12,600 |
| 2013 | $1,583 | $14,885 | $1,818 | $13,067 |
Source: Public Records
Map
Nearby Homes
- 715 Water St
- 457 S Desplaines St
- 714 S Joliet St
- 454 S Desplaines St
- 411 Pleasant St
- 500 S Ottawa St
- 508 Mcdonough St
- 310 Pleasant St
- 516 S Eastern Ave
- 508 S Eastern Ave
- 324 Illinois St
- 334 S Ottawa St
- 304 S Desplaines St
- 167 Wallace St
- 230 Comstock St
- 802 Woods Ave
- 107 4th Ave
- 806 Woods Ave
- 800 W Park Ave
- 8 Osgood St