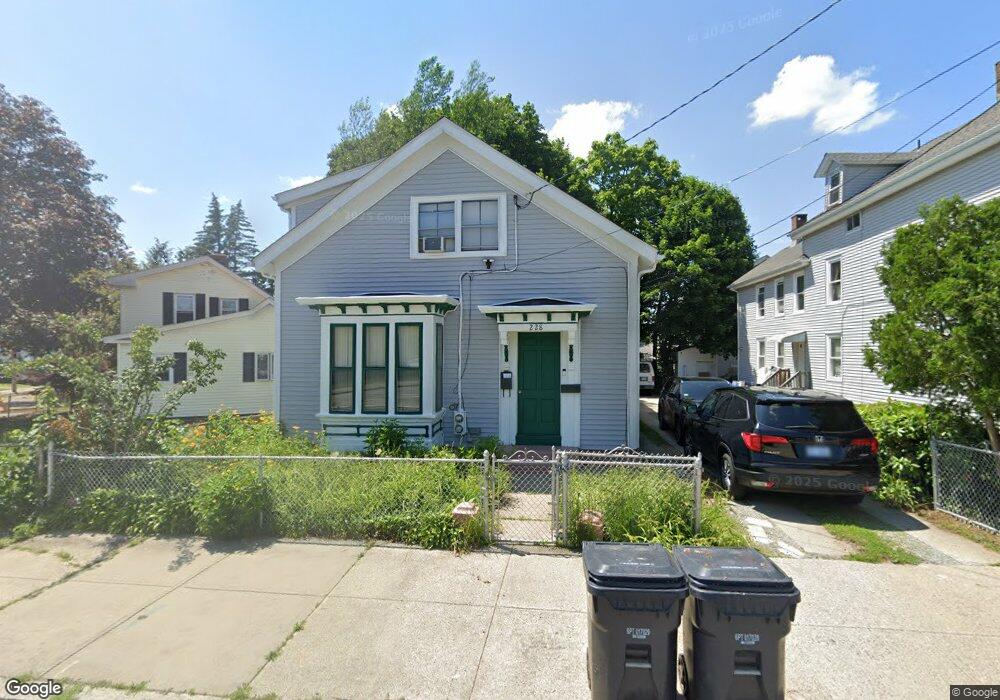
228 Dunnell Ave Pawtucket, RI 02860
Woodlawn NeighborhoodEstimated Value: $481,000 - $559,000
4
Beds
2
Baths
1,861
Sq Ft
$281/Sq Ft
Est. Value
About This Home
This home is located at 228 Dunnell Ave, Pawtucket, RI 02860 and is currently estimated at $523,518, approximately $281 per square foot. 228 Dunnell Ave is a home located in Providence County with nearby schools including International Charter School, Blackstone Academy Charter School, and Ocean Tides School.
Ownership History
Date
Name
Owned For
Owner Type
Purchase Details
Closed on
Feb 1, 1999
Sold by
Juris Rlty Assoc Inc
Bought by
Moreira Pedro S
Current Estimated Value
Home Financials for this Owner
Home Financials are based on the most recent Mortgage that was taken out on this home.
Original Mortgage
$74,600
Interest Rate
6.67%
Create a Home Valuation Report for This Property
The Home Valuation Report is an in-depth analysis detailing your home's value as well as a comparison with similar homes in the area
Home Values in the Area
Average Home Value in this Area
Purchase History
| Date | Buyer | Sale Price | Title Company |
|---|---|---|---|
| Moreira Pedro S | $75,000 | -- |
Source: Public Records
Mortgage History
| Date | Status | Borrower | Loan Amount |
|---|---|---|---|
| Open | Moreira Pedro S | $154,000 | |
| Closed | Moreira Pedro S | $128,000 | |
| Closed | Moreira Pedro S | $74,600 | |
| Previous Owner | Moreira Pedro S | $32,000 |
Source: Public Records
Tax History
| Year | Tax Paid | Tax Assessment Tax Assessment Total Assessment is a certain percentage of the fair market value that is determined by local assessors to be the total taxable value of land and additions on the property. | Land | Improvement |
|---|---|---|---|---|
| 2025 | $4,794 | $364,600 | $116,900 | $247,700 |
| 2024 | $4,499 | $364,600 | $116,900 | $247,700 |
| 2023 | $3,859 | $227,800 | $52,600 | $175,200 |
| 2022 | $3,777 | $227,800 | $52,600 | $175,200 |
| 2021 | $3,777 | $227,800 | $52,600 | $175,200 |
| 2020 | $3,541 | $169,500 | $53,300 | $116,200 |
| 2019 | $3,541 | $169,500 | $53,300 | $116,200 |
| 2018 | $3,412 | $169,500 | $53,300 | $116,200 |
| 2017 | $2,983 | $131,300 | $40,100 | $91,200 |
| 2016 | $2,874 | $131,300 | $40,100 | $91,200 |
| 2015 | $2,874 | $131,300 | $40,100 | $91,200 |
| 2014 | $3,106 | $134,700 | $51,500 | $83,200 |
Source: Public Records
Map
Nearby Homes
Your Personal Tour Guide
Ask me questions while you tour the home.