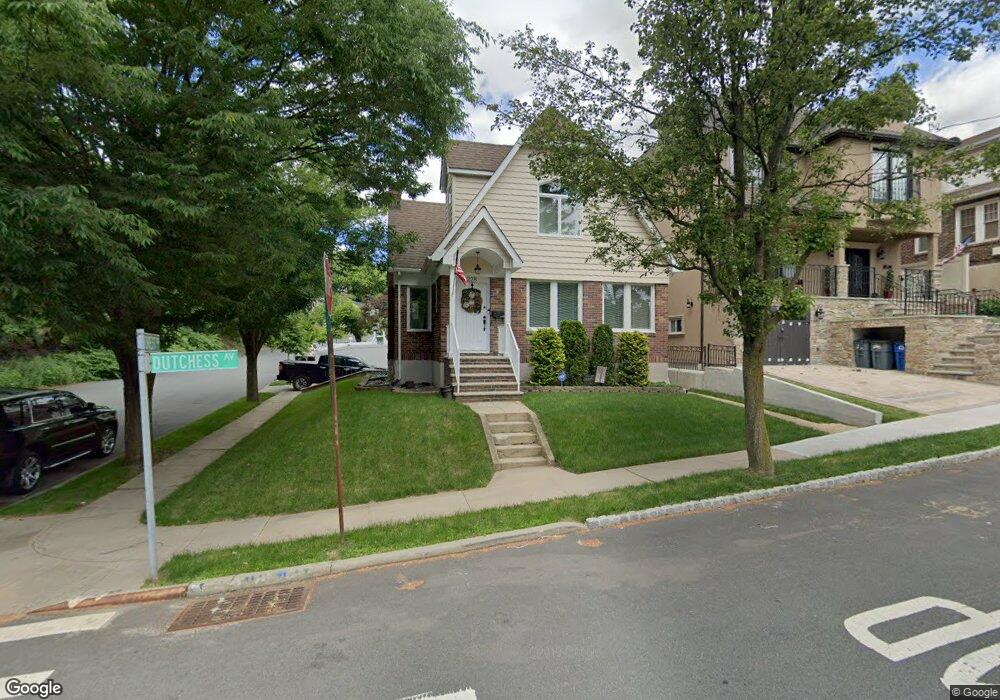
228 Dutchess Ave Staten Island, NY 10304
Dongan Hills NeighborhoodEstimated Value: $1,078,580 - $1,186,000
4
Beds
3
Baths
2,528
Sq Ft
$446/Sq Ft
Est. Value
About This Home
This home is located at 228 Dutchess Ave, Staten Island, NY 10304 and is currently estimated at $1,126,895, approximately $445 per square foot. 228 Dutchess Ave is a home located in Richmond County with nearby schools including P.S. 11 Thomas Dongan School, Myra S. Barnes Intermediate School 24, and Susan E Wagner High School.
Ownership History
Date
Name
Owned For
Owner Type
Purchase Details
Closed on
Aug 1, 2012
Sold by
Barone Donna
Bought by
Barone Daniel and Barone Jaclyn
Current Estimated Value
Home Financials for this Owner
Home Financials are based on the most recent Mortgage that was taken out on this home.
Original Mortgage
$417,000
Interest Rate
3.61%
Mortgage Type
New Conventional
Create a Home Valuation Report for This Property
The Home Valuation Report is an in-depth analysis detailing your home's value as well as a comparison with similar homes in the area
Home Values in the Area
Average Home Value in this Area
Purchase History
| Date | Buyer | Sale Price | Title Company |
|---|---|---|---|
| Barone Daniel | $522,000 | Chicago Title Insurance Co |
Source: Public Records
Mortgage History
| Date | Status | Borrower | Loan Amount |
|---|---|---|---|
| Closed | Barone Daniel | $417,000 |
Source: Public Records
Tax History Compared to Growth
Tax History
| Year | Tax Paid | Tax Assessment Tax Assessment Total Assessment is a certain percentage of the fair market value that is determined by local assessors to be the total taxable value of land and additions on the property. | Land | Improvement |
|---|---|---|---|---|
| 2025 | $8,955 | $67,500 | $8,360 | $59,140 |
| 2024 | $8,955 | $72,060 | $7,388 | $64,672 |
| 2023 | $9,055 | $44,587 | $7,965 | $36,622 |
| 2022 | $8,663 | $67,440 | $11,940 | $55,500 |
| 2021 | $8,786 | $57,960 | $11,940 | $46,020 |
| 2020 | $8,041 | $63,180 | $11,940 | $51,240 |
| 2019 | $7,480 | $54,900 | $11,940 | $42,960 |
| 2018 | $7,277 | $37,156 | $8,689 | $28,467 |
| 2017 | $7,072 | $36,162 | $7,599 | $28,563 |
| 2016 | $6,645 | $34,790 | $7,788 | $27,002 |
| 2015 | $5,637 | $32,821 | $7,323 | $25,498 |
| 2014 | $5,637 | $30,964 | $8,290 | $22,674 |
Source: Public Records
Map
Nearby Homes