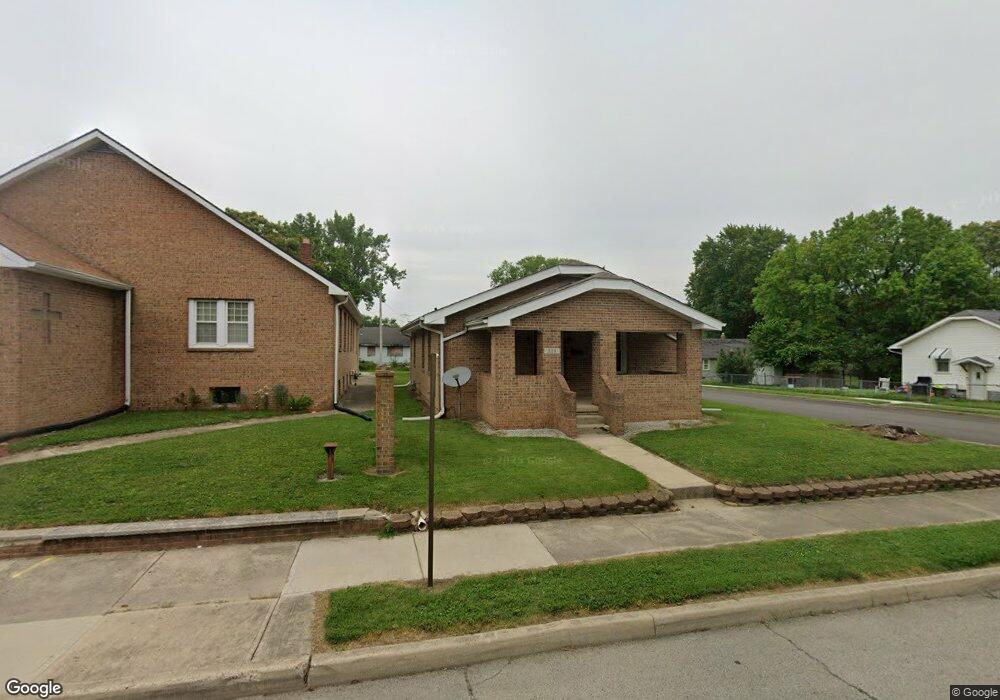
228 E 31st St Anderson, IN 46016
Estimated Value: $60,000 - $86,912
2
Beds
1
Bath
936
Sq Ft
$81/Sq Ft
Est. Value
About This Home
This home is located at 228 E 31st St, Anderson, IN 46016 and is currently estimated at $75,728, approximately $80 per square foot. 228 E 31st St is a home located in Madison County with nearby schools including Erskine Elementary School, Highland Middle School, and Anderson High School.
Ownership History
Date
Name
Owned For
Owner Type
Purchase Details
Closed on
Jan 16, 2023
Sold by
Hart Ronald E
Bought by
Reh Properties Inc
Current Estimated Value
Purchase Details
Closed on
Nov 4, 2021
Sold by
Hart Michael J
Bought by
Markle Susan J
Purchase Details
Closed on
Jul 20, 2009
Sold by
Munitax Fund Llc
Bought by
Hart E E and Hart Michael J
Purchase Details
Closed on
Jan 11, 2007
Sold by
Harrison James M and Harrison Karen L
Bought by
Munitax Fund Llc
Purchase Details
Closed on
Oct 24, 2006
Sold by
Harrison James M
Bought by
Hfg Llc
Create a Home Valuation Report for This Property
The Home Valuation Report is an in-depth analysis detailing your home's value as well as a comparison with similar homes in the area
Home Values in the Area
Average Home Value in this Area
Purchase History
| Date | Buyer | Sale Price | Title Company |
|---|---|---|---|
| Reh Properties Inc | -- | -- | |
| Markle Susan J | -- | -- | |
| Hart E E | -- | -- | |
| Munitax Fund Llc | $25,000 | -- | |
| Hfg Llc | -- | -- |
Source: Public Records
Tax History Compared to Growth
Tax History
| Year | Tax Paid | Tax Assessment Tax Assessment Total Assessment is a certain percentage of the fair market value that is determined by local assessors to be the total taxable value of land and additions on the property. | Land | Improvement |
|---|---|---|---|---|
| 2025 | $1,124 | $50,600 | $8,200 | $42,400 |
| 2024 | $1,124 | $50,600 | $8,200 | $42,400 |
| 2023 | $1,042 | $46,500 | $7,800 | $38,700 |
| 2022 | $982 | $43,800 | $7,400 | $36,400 |
| 2021 | $907 | $40,200 | $7,300 | $32,900 |
| 2020 | $867 | $38,300 | $7,000 | $31,300 |
| 2019 | $848 | $37,400 | $7,000 | $30,400 |
| 2018 | $711 | $30,700 | $7,000 | $23,700 |
| 2017 | $608 | $30,300 | $7,000 | $23,300 |
| 2016 | $608 | $30,300 | $7,000 | $23,300 |
| 2014 | $660 | $33,000 | $3,800 | $29,200 |
| 2013 | $660 | $33,000 | $3,800 | $29,200 |
Source: Public Records
Map
Nearby Homes
- 2915 Central Ave
- 2806 Meridian St
- 2639 Central Ave
- 621 E 31st St
- 320 E 34th St
- 309 E 34th St
- 711 E 32nd St
- 312 W 29th St
- 2519 Jackson St
- 115 South Dr
- 128 Ringwood Way
- 128 E 36th St
- 148 South Dr
- 2420 Fletcher St
- 2410 Central Ave
- 2328 Fletcher St
- 2310 Main St
- 2530 Lincoln St
- 3302 Columbus Ave
- 3411 Columbus Ave