228 E 700 N Centerville, UT 84014
Estimated Value: $484,000 - $526,097
3
Beds
3
Baths
2,280
Sq Ft
$223/Sq Ft
Est. Value
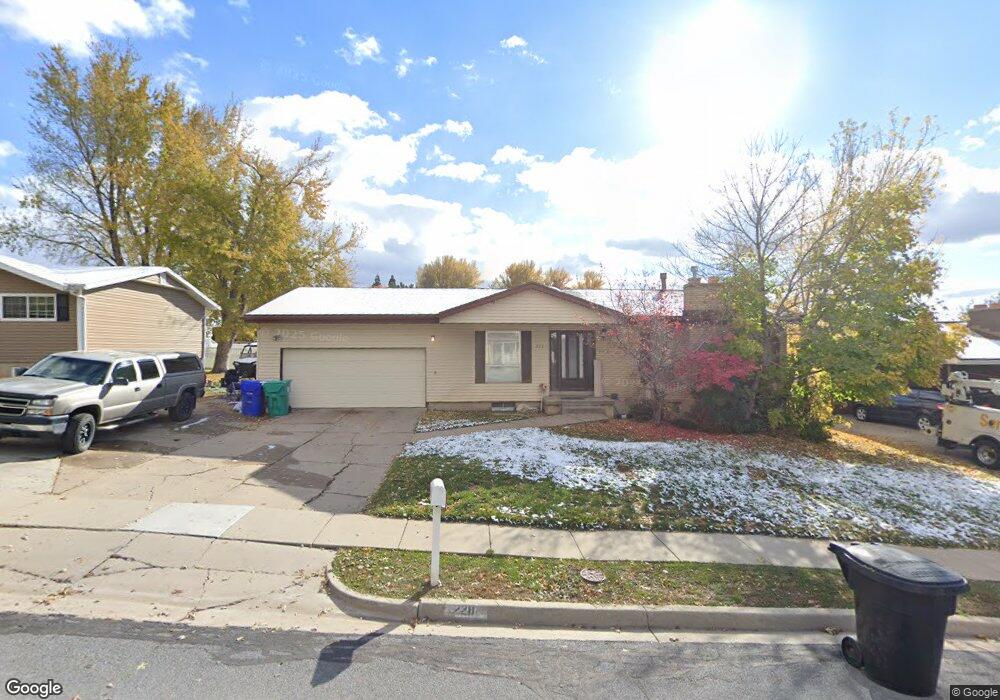
About This Home
This home is located at 228 E 700 N, Centerville, UT 84014 and is currently estimated at $508,524, approximately $223 per square foot. 228 E 700 N is a home located in Davis County with nearby schools including Centerville Elementary, Centerville Jr High, and Viewmont High School.
Ownership History
Date
Name
Owned For
Owner Type
Purchase Details
Closed on
Nov 5, 2025
Sold by
Hendriks Hubert and Hendriks Cindy L
Bought by
Hubert And Cindy Hendriks Family Trust and Hendriks
Current Estimated Value
Purchase Details
Closed on
May 7, 2020
Sold by
Hendriks Hubert
Bought by
Hendriks Hubert and Hendriks Cindy L
Home Financials for this Owner
Home Financials are based on the most recent Mortgage that was taken out on this home.
Original Mortgage
$202,500
Interest Rate
3.5%
Mortgage Type
New Conventional
Purchase Details
Closed on
Oct 22, 2008
Sold by
Horton Eulala Ann Reese
Bought by
Hendriks Hubert and Hendriks Cindy L
Home Financials for this Owner
Home Financials are based on the most recent Mortgage that was taken out on this home.
Original Mortgage
$199,430
Interest Rate
5.9%
Mortgage Type
FHA
Purchase Details
Closed on
Feb 26, 2002
Sold by
Reese Eulala Ann
Bought by
Horton Eulala Ann Reese
Create a Home Valuation Report for This Property
The Home Valuation Report is an in-depth analysis detailing your home's value as well as a comparison with similar homes in the area
Purchase History
| Date | Buyer | Sale Price | Title Company |
|---|---|---|---|
| Hubert And Cindy Hendriks Family Trust | -- | None Listed On Document | |
| Hendriks Hubert | -- | None Available | |
| Hendriks Hubert | -- | Sutherland Title Company | |
| Hendriks Hubert | -- | First American Title | |
| Horton Eulala Ann Reese | -- | -- |
Source: Public Records
Mortgage History
| Date | Status | Borrower | Loan Amount |
|---|---|---|---|
| Previous Owner | Hendriks Hubert | $202,500 | |
| Previous Owner | Hendriks Hubert | $199,430 |
Source: Public Records
Tax History
| Year | Tax Paid | Tax Assessment Tax Assessment Total Assessment is a certain percentage of the fair market value that is determined by local assessors to be the total taxable value of land and additions on the property. | Land | Improvement |
|---|---|---|---|---|
| 2025 | $2,794 | $267,300 | $159,158 | $108,142 |
| 2024 | $2,787 | $271,151 | $142,071 | $129,080 |
| 2023 | $2,693 | $449,000 | $234,332 | $214,668 |
| 2022 | $2,687 | $260,150 | $118,061 | $142,089 |
| 2021 | $2,394 | $361,000 | $178,671 | $182,329 |
| 2020 | $2,070 | $312,000 | $175,308 | $136,692 |
| 2019 | $2,170 | $307,000 | $178,450 | $128,550 |
| 2018 | $2,042 | $281,000 | $165,737 | $115,263 |
| 2016 | $1,630 | $131,780 | $54,030 | $77,750 |
| 2015 | $1,639 | $120,780 | $54,030 | $66,750 |
| 2014 | $1,628 | $127,034 | $54,607 | $72,427 |
| 2013 | -- | $112,489 | $44,204 | $68,285 |
Source: Public Records
Map
Nearby Homes
- 295 E 500 N
- 871 Poplar Cir
- 22 Creekside Ln
- 67 W Pheasantbrook Dr
- 775 Pheasantbrook Cir
- 380 E 400 N
- 833 N Lakeside Ln
- 147 W 925 N
- 282 W 605 N Unit I
- 281 W 650 N Unit B
- 252 N 400 E
- 292 W 680 N
- 303 W 650 N Unit I
- 56 W 200 N
- 751 Pheasantbrook Dr
- 763 Pheasantbrook Dr
- 781 Pheasantbrook Dr
- 271 Brookfield Ln
- 360 E Center St
- 493 W 620 N Unit 122
Your Personal Tour Guide
Ask me questions while you tour the home.