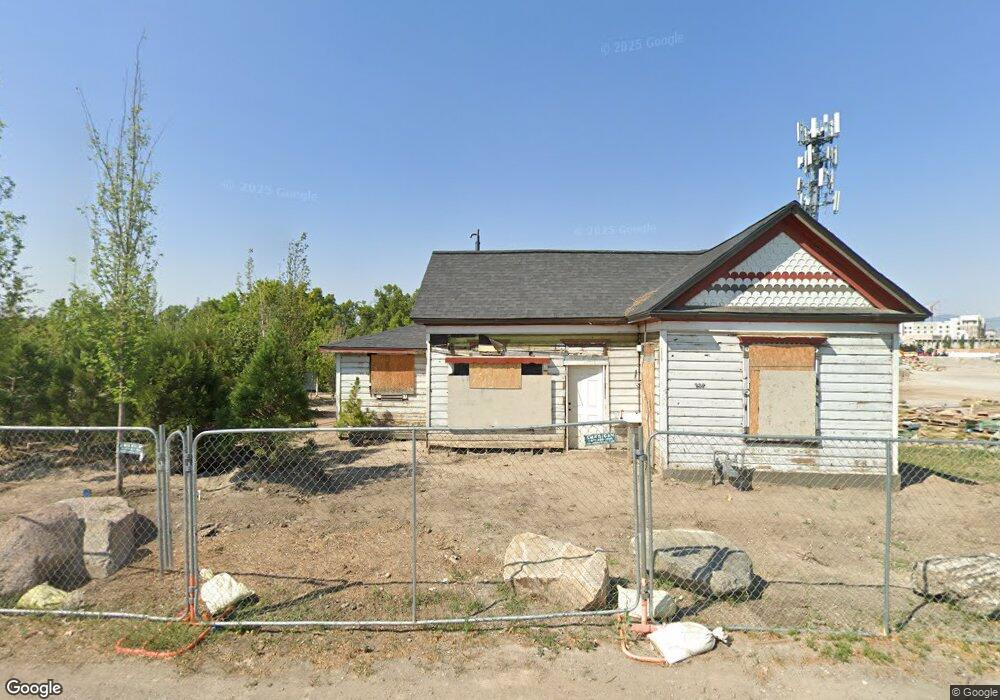
228 E Gordon Ln S Millcreek, UT 84107
Estimated Value: $704,000 - $1,497,000
2
Beds
1
Bath
1,100
Sq Ft
$1,000/Sq Ft
Est. Value
About This Home
This home is located at 228 E Gordon Ln S, Millcreek, UT 84107 and is currently estimated at $1,100,500, approximately $1,000 per square foot. 228 E Gordon Ln S is a home located in Salt Lake County with nearby schools including Parkside Elementary School, Hillcrest Junior High School, and Murray High School.
Ownership History
Date
Name
Owned For
Owner Type
Purchase Details
Closed on
Sep 30, 2024
Sold by
Deangelis Christina A
Bought by
1804 South Llc
Current Estimated Value
Home Financials for this Owner
Home Financials are based on the most recent Mortgage that was taken out on this home.
Original Mortgage
$632,024
Outstanding Balance
$530,923
Interest Rate
6.49%
Mortgage Type
New Conventional
Estimated Equity
$569,577
Purchase Details
Closed on
Oct 23, 2018
Sold by
Clark Matthew R
Bought by
Deangelis Christina A
Purchase Details
Closed on
Apr 2, 2018
Sold by
Clark Matthew R
Bought by
Deangelis Charistina A
Purchase Details
Closed on
May 8, 2008
Sold by
Orion Property Management Llc
Bought by
Clark Robert L and Clark Julie B
Purchase Details
Closed on
Jun 22, 2006
Sold by
Clark Anne Elizabeth
Bought by
Clark Robert L and Clark Julie Ann Beal
Create a Home Valuation Report for This Property
The Home Valuation Report is an in-depth analysis detailing your home's value as well as a comparison with similar homes in the area
Home Values in the Area
Average Home Value in this Area
Purchase History
| Date | Buyer | Sale Price | Title Company |
|---|---|---|---|
| 1804 South Llc | -- | Union Title | |
| Deangelis Christina A | -- | None Available | |
| Deangelis Charistina A | -- | Meridian Title | |
| Clark Matthew R | -- | Meridian Title | |
| Clark Robert L | -- | None Available | |
| Clark Robert L | -- | None Available | |
| Clark Robert L | -- | None Available |
Source: Public Records
Mortgage History
| Date | Status | Borrower | Loan Amount |
|---|---|---|---|
| Open | 1804 South Llc | $632,024 |
Source: Public Records
Tax History Compared to Growth
Tax History
| Year | Tax Paid | Tax Assessment Tax Assessment Total Assessment is a certain percentage of the fair market value that is determined by local assessors to be the total taxable value of land and additions on the property. | Land | Improvement |
|---|---|---|---|---|
| 2025 | $8,597 | $806,600 | $804,100 | $2,500 |
| 2024 | $8,597 | $736,700 | $734,200 | $2,500 |
| 2023 | $7,503 | $620,200 | $617,700 | $2,500 |
| 2022 | $6,239 | $515,300 | $512,800 | $2,500 |
| 2021 | $6,621 | $480,300 | $477,800 | $2,500 |
| 2020 | $6,834 | $468,700 | $466,200 | $2,500 |
| 2019 | $7,288 | $488,200 | $466,200 | $22,000 |
| 2018 | $0 | $200,290 | $155,990 | $44,300 |
| 2017 | $1,853 | $194,990 | $155,990 | $39,000 |
| 2016 | $1,321 | $160,890 | $131,390 | $29,500 |
| 2015 | $1,577 | $180,190 | $128,790 | $51,400 |
| 2014 | $1,455 | $162,690 | $119,590 | $43,100 |
Source: Public Records
Map
Nearby Homes
- 598 E Betsey Cove S Unit 19
- 597 E Betsey Cove Cove S Unit 24
- 599 E Savvy Cove S Unit 44
- 5313 Alpine Dr
- 421 E Saunders St
- 5442 S Avalon Dr
- 415 E Creekside Cir Unit B
- 5396 S Willow Ln Unit E
- 469 E Vine St
- 416 E Creekside Cir Unit C
- 426 E Creekside Cir Unit B
- 576 E Vine St Unit 3B
- 460 E Creekside Cir Unit B
- 440 E Creekside Cir Unit D
- 313 Elm St
- 5323 S 560 E Unit D
- 5327 S 560 E Unit F
- 572 E 5300 S
- 5505 S Willow Ln Unit E
- 5320 S 570 E Unit L
- 5063 S 875 Canyon E Unit 15
- 225 E Baltmore S
- 331 W 4800 S
- 5069 S 875 E Unit 19
- 5073 S 875 E
- 5070 S 875 E Unit 9
- 5074 S 875 E Unit 29
- 5079 S 875 E Unit 46
- 5069 S 875 E
- 5063 S 875 Canyon E Unit 16
- 541 E Fashion Ct
- 5079 S 875 E Unit 45
- 5069 S 875 E Unit 21
- 5079 S 875 E
- 5064 S 875 E
- 5063 S 875 Canyon E Unit 18
- 5080 S 875 E Unit 36
- 5080 S 875 E
- 5079 S 875 E Unit 39
- 5073 S 875 E Unit 41