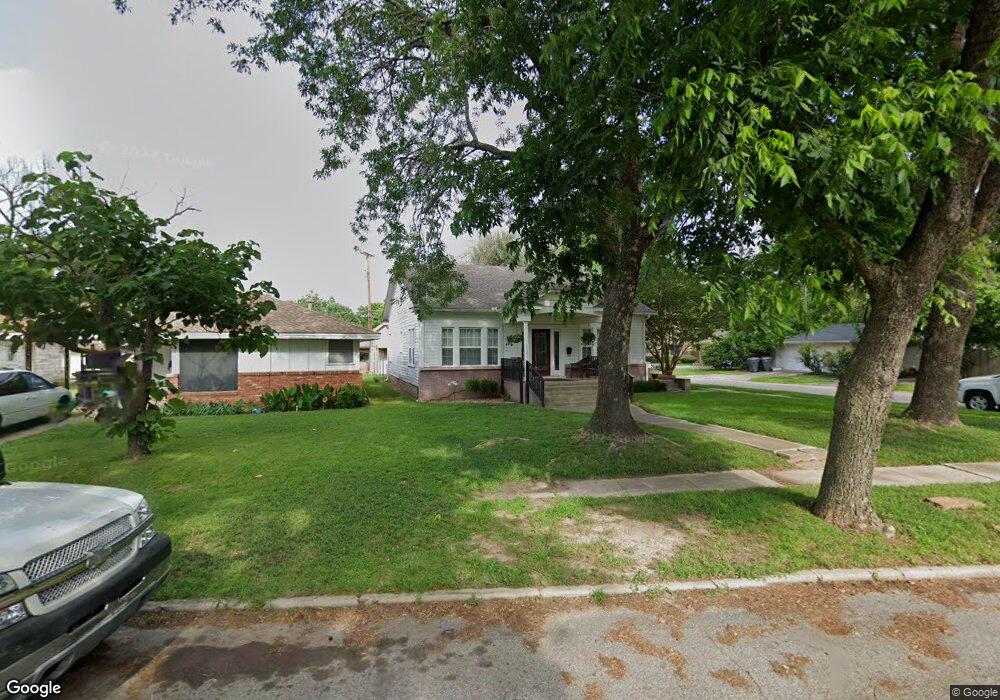
228 E St SW Ardmore, OK 73401
Estimated Value: $174,739 - $407,000
4
Beds
3
Baths
1,668
Sq Ft
$162/Sq Ft
Est. Value
About This Home
This home is located at 228 E St SW, Ardmore, OK 73401 and is currently estimated at $270,685, approximately $162 per square foot. 228 E St SW is a home located in Carter County with nearby schools including Lincoln Elementary School, Ardmore Middle School, and Ardmore High School.
Ownership History
Date
Name
Owned For
Owner Type
Purchase Details
Closed on
Jan 8, 2020
Sold by
Stolfa Ronald J and Stolfa Ann
Bought by
Hull Gabriel and Hull Brandi
Current Estimated Value
Home Financials for this Owner
Home Financials are based on the most recent Mortgage that was taken out on this home.
Original Mortgage
$321,319
Outstanding Balance
$252,328
Interest Rate
3.6%
Mortgage Type
Commercial
Estimated Equity
$18,357
Purchase Details
Closed on
Jul 13, 2005
Sold by
Householder Donna S
Bought by
Stolfa Roland J and Stolfa Ann Nicole
Home Financials for this Owner
Home Financials are based on the most recent Mortgage that was taken out on this home.
Original Mortgage
$95,200
Interest Rate
5.64%
Mortgage Type
New Conventional
Purchase Details
Closed on
May 11, 2000
Sold by
Gentry Horace and Gentry Carol
Bought by
Householder Daryl G And
Create a Home Valuation Report for This Property
The Home Valuation Report is an in-depth analysis detailing your home's value as well as a comparison with similar homes in the area
Home Values in the Area
Average Home Value in this Area
Purchase History
| Date | Buyer | Sale Price | Title Company |
|---|---|---|---|
| Hull Gabriel | $300,000 | None Available | |
| Stolfa Roland J | $119,000 | -- | |
| Householder Daryl G And | $70,000 | -- |
Source: Public Records
Mortgage History
| Date | Status | Borrower | Loan Amount |
|---|---|---|---|
| Open | Hull Gabriel | $321,319 | |
| Previous Owner | Stolfa Roland J | $95,200 |
Source: Public Records
Tax History Compared to Growth
Tax History
| Year | Tax Paid | Tax Assessment Tax Assessment Total Assessment is a certain percentage of the fair market value that is determined by local assessors to be the total taxable value of land and additions on the property. | Land | Improvement |
|---|---|---|---|---|
| 2024 | $1,397 | $13,323 | $1,800 | $11,523 |
| 2023 | $1,330 | $12,689 | $1,800 | $10,889 |
| 2022 | $1,155 | $12,085 | $1,800 | $10,285 |
| 2021 | $1,161 | $11,510 | $1,800 | $9,710 |
| 2020 | $1,467 | $15,752 | $2,400 | $13,352 |
| 2019 | $1,432 | $15,752 | $2,400 | $13,352 |
| 2018 | $1,456 | $15,752 | $2,400 | $13,352 |
| 2017 | $1,375 | $16,039 | $2,400 | $13,639 |
| 2016 | $1,388 | $15,891 | $720 | $15,171 |
| 2015 | $1,115 | $15,511 | $264 | $15,247 |
| 2014 | $1,268 | $15,174 | $264 | $14,910 |
Source: Public Records
Map
Nearby Homes