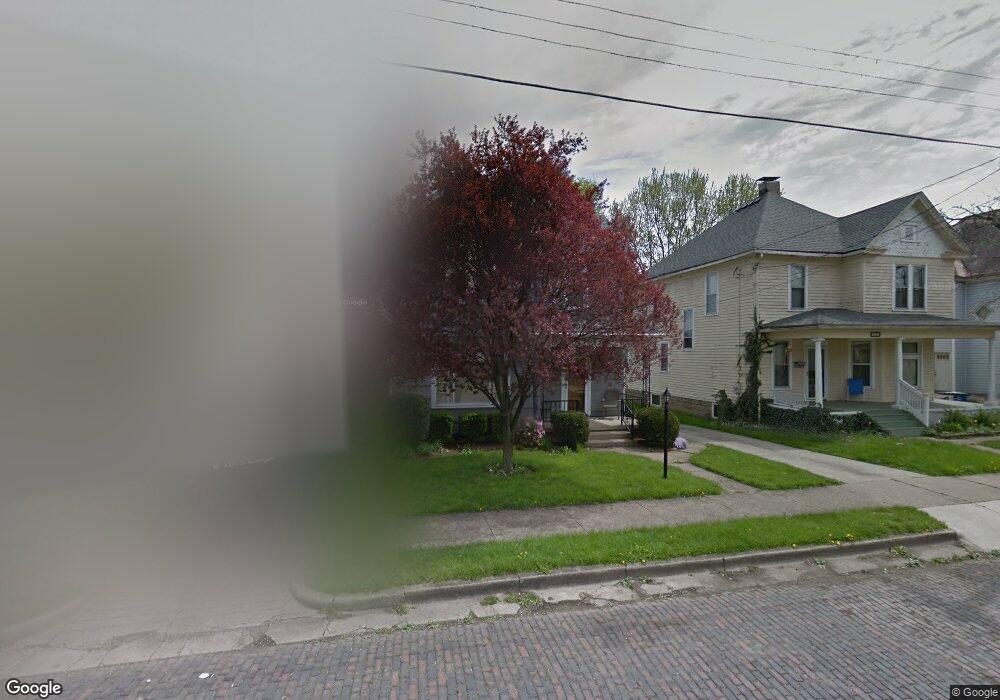
228 Eddy St Newark, OH 43055
Estimated Value: $167,234 - $212,000
2
Beds
2
Baths
1,240
Sq Ft
$147/Sq Ft
Est. Value
About This Home
This home is located at 228 Eddy St, Newark, OH 43055 and is currently estimated at $182,809, approximately $147 per square foot. 228 Eddy St is a home located in Licking County with nearby schools including John Clem Elementary School, Liberty Middle School, and Newark High School.
Ownership History
Date
Name
Owned For
Owner Type
Purchase Details
Closed on
Apr 17, 2015
Sold by
Stickles Mathew Wayne
Bought by
Ridenbaugh Brandon L
Current Estimated Value
Home Financials for this Owner
Home Financials are based on the most recent Mortgage that was taken out on this home.
Original Mortgage
$79,568
Outstanding Balance
$60,143
Interest Rate
3.25%
Mortgage Type
FHA
Estimated Equity
$122,666
Purchase Details
Closed on
Apr 13, 2009
Sold by
Gant Brian M and Gant Janelle R
Bought by
Stickles Mathew Wayne
Home Financials for this Owner
Home Financials are based on the most recent Mortgage that was taken out on this home.
Original Mortgage
$73,800
Interest Rate
5.05%
Mortgage Type
Unknown
Purchase Details
Closed on
Jun 16, 1999
Sold by
Bernice M Deck Est
Bought by
Gant Brian M and Gant Janelle R
Create a Home Valuation Report for This Property
The Home Valuation Report is an in-depth analysis detailing your home's value as well as a comparison with similar homes in the area
Home Values in the Area
Average Home Value in this Area
Purchase History
| Date | Buyer | Sale Price | Title Company |
|---|---|---|---|
| Ridenbaugh Brandon L | $127,500 | None Available | |
| Stickles Mathew Wayne | $82,000 | Kent Title | |
| Gant Brian M | $57,500 | -- |
Source: Public Records
Mortgage History
| Date | Status | Borrower | Loan Amount |
|---|---|---|---|
| Open | Ridenbaugh Brandon L | $79,568 | |
| Previous Owner | Stickles Mathew Wayne | $73,800 | |
| Closed | Gant Brian M | -- |
Source: Public Records
Tax History
| Year | Tax Paid | Tax Assessment Tax Assessment Total Assessment is a certain percentage of the fair market value that is determined by local assessors to be the total taxable value of land and additions on the property. | Land | Improvement |
|---|---|---|---|---|
| 2024 | $1,661 | $46,310 | $13,020 | $33,290 |
| 2023 | $1,660 | $46,310 | $13,020 | $33,290 |
| 2022 | $1,516 | $37,600 | $7,320 | $30,280 |
| 2021 | $1,590 | $37,600 | $7,320 | $30,280 |
| 2020 | $1,628 | $37,600 | $7,320 | $30,280 |
| 2019 | $1,320 | $29,370 | $6,090 | $23,280 |
| 2018 | $1,321 | $0 | $0 | $0 |
| 2017 | $1,242 | $0 | $0 | $0 |
| 2016 | $1,193 | $0 | $0 | $0 |
| 2015 | $1,219 | $0 | $0 | $0 |
| 2014 | $1,554 | $0 | $0 | $0 |
| 2013 | $1,177 | $0 | $0 | $0 |
Source: Public Records
Map
Nearby Homes
- 236 N 10th St
- 210 Buckingham St
- 218 Granville St
- 99 Hoover St
- 185 N 10th St
- 355 Eddy St
- 69 Wallace St
- 293 Merchant St
- 191 Elmwood Ave
- 122 W Shields St
- 242 Hudson Ave
- 12 E Saint Clair St
- 361 Granville St
- 27 W North St
- 311 Clinton St
- 441 Mount Vernon Rd
- 408 Granville St
- 377 Saint James Gate
- 24 Elizabeth St
- 59 Jefferson St
Your Personal Tour Guide
Ask me questions while you tour the home.