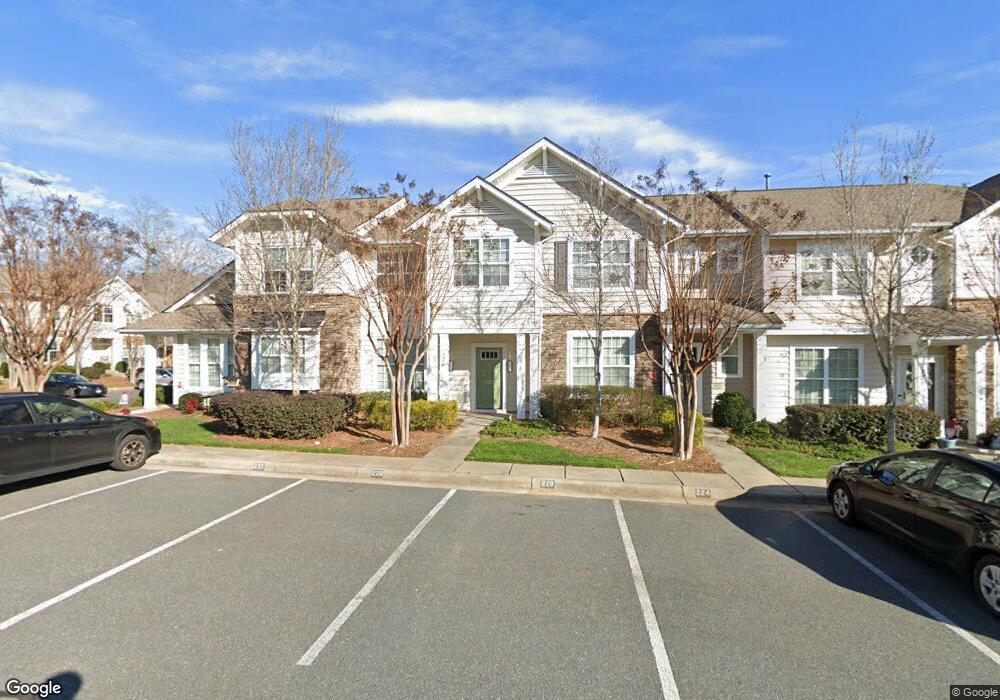
228 Falling Ridge Unit 151 Belmont, NC 28012
Estimated Value: $296,000 - $321,000
3
Beds
3
Baths
1,373
Sq Ft
$223/Sq Ft
Est. Value
About This Home
This home is located at 228 Falling Ridge Unit 151, Belmont, NC 28012 and is currently estimated at $306,739, approximately $223 per square foot. 228 Falling Ridge Unit 151 is a home located in Gaston County with nearby schools including Catawba Heights Elementary School, Belmont Middle School, and South Point High School.
Ownership History
Date
Name
Owned For
Owner Type
Purchase Details
Closed on
May 31, 2016
Sold by
Beal Gregory William and Chan Joyce Yuen Kwon
Bought by
Todd Michael A
Current Estimated Value
Home Financials for this Owner
Home Financials are based on the most recent Mortgage that was taken out on this home.
Original Mortgage
$158,251
Outstanding Balance
$125,991
Interest Rate
3.58%
Mortgage Type
New Conventional
Estimated Equity
$180,748
Purchase Details
Closed on
Jul 9, 2014
Sold by
Beal Graciela Chaves
Bought by
Beal Gregory W
Purchase Details
Closed on
Oct 15, 2010
Sold by
Standard Pacific Of The Carolinas Llc
Bought by
Beal Gregory W and Beal Graciela Chaves
Home Financials for this Owner
Home Financials are based on the most recent Mortgage that was taken out on this home.
Original Mortgage
$153,756
Interest Rate
4.36%
Mortgage Type
New Conventional
Create a Home Valuation Report for This Property
The Home Valuation Report is an in-depth analysis detailing your home's value as well as a comparison with similar homes in the area
Home Values in the Area
Average Home Value in this Area
Purchase History
| Date | Buyer | Sale Price | Title Company |
|---|---|---|---|
| Todd Michael A | $154,000 | None Available | |
| Beal Gregory W | -- | None Available | |
| Beal Gregory W | $148,500 | None Available |
Source: Public Records
Mortgage History
| Date | Status | Borrower | Loan Amount |
|---|---|---|---|
| Open | Todd Michael A | $158,251 | |
| Previous Owner | Beal Gregory W | $153,756 |
Source: Public Records
Tax History Compared to Growth
Tax History
| Year | Tax Paid | Tax Assessment Tax Assessment Total Assessment is a certain percentage of the fair market value that is determined by local assessors to be the total taxable value of land and additions on the property. | Land | Improvement |
|---|---|---|---|---|
| 2025 | $2,831 | $281,940 | $38,000 | $243,940 |
| 2024 | $2,831 | $281,940 | $38,000 | $243,940 |
| 2023 | $2,862 | $281,940 | $38,000 | $243,940 |
| 2022 | $2,280 | $176,040 | $32,500 | $143,540 |
| 2021 | $2,240 | $170,340 | $32,500 | $137,840 |
| 2019 | $2,257 | $170,340 | $32,500 | $137,840 |
| 2018 | $1,993 | $142,358 | $20,800 | $121,558 |
| 2017 | $1,993 | $142,358 | $20,800 | $121,558 |
| 2016 | $1,239 | $142,358 | $0 | $0 |
| 2014 | $1,334 | $153,286 | $32,000 | $121,286 |
Source: Public Records
Map
Nearby Homes
- 764 River Park Rd
- 720 River Park Rd
- 436 Spring Gardens Dr
- 713 Henderson Valley Way
- 300 Park View Dr
- 205 Park View Dr
- 456 Spring Gardens Dr
- 108 Park View Dr
- 1033 Beatty Woods Dr
- 1034 Beatty Woods Dr
- 104 Lighthouse Rd
- 120 Prairie View Ct
- 229 Howard St
- 116 Huckleberry Ln
- 305 E Henry St
- 308 Rock Ridge Ln
- 141 Rock Ridge Ln
- 107 Oakland Rd
- 402 Beaty Rd
- 108 E Main St
- 228 Falling Ridge
- 224 Falling Ridge
- 224 Falling Ridge
- 224 Falling Ridge Unit 150
- 232 Falling Ridge
- 220 Falling Ridge
- 220 Falling Ridge Unit 149
- 216 Falling Ridge
- 769 River Park Rd
- 760 River Park Rd
- 769 River Park Rd Unit 236
- 777 River Park Rd Unit 238
- 780 River Park Rd
- 776 River Park Rd
- 772 River Park Rd
- 780 River Park Rd Unit 199
- 776 River Park Rd Unit 198
- 772 River Park Rd Unit 197
- 717 River Park Rd
- 713 River Park Rd