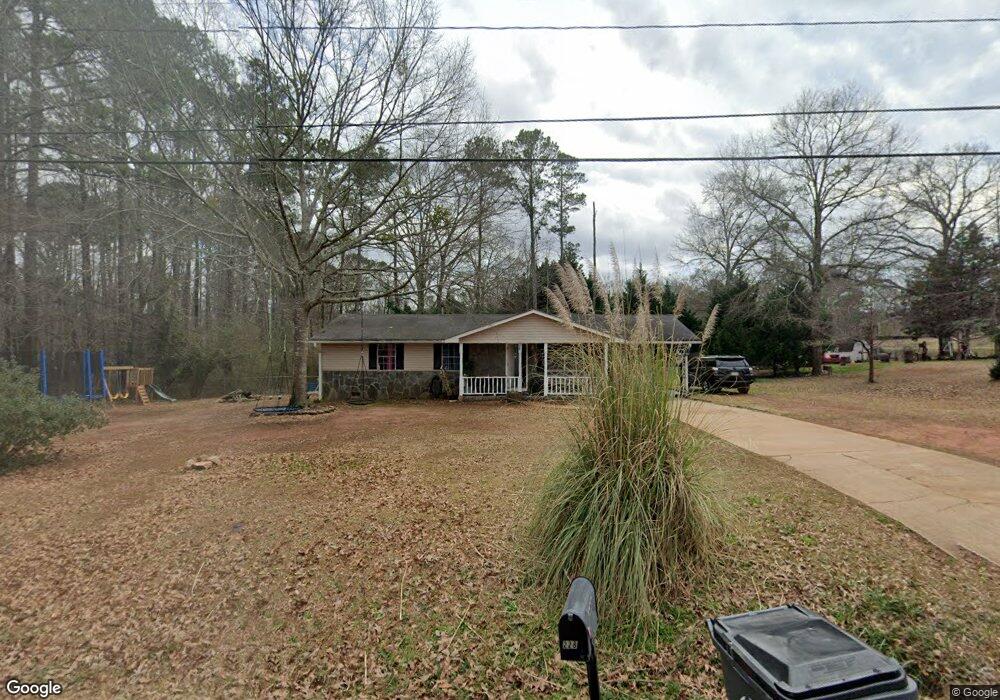
228 Grove Rd Locust Grove, GA 30248
Estimated Value: $175,000 - $240,000
3
Beds
2
Baths
1,080
Sq Ft
$189/Sq Ft
Est. Value
About This Home
This home is located at 228 Grove Rd, Locust Grove, GA 30248 and is currently estimated at $204,043, approximately $188 per square foot. 228 Grove Rd is a home located in Henry County with nearby schools including Unity Grove Elementary School, Locust Grove Middle School, and Locust Grove High School.
Ownership History
Date
Name
Owned For
Owner Type
Purchase Details
Closed on
Nov 18, 2016
Sold by
Urban Property Solutions L
Bought by
Kayl Holdings Llc
Current Estimated Value
Purchase Details
Closed on
Aug 11, 2015
Sold by
Collett Shanna D
Bought by
Urban Property Solutions Llc
Home Financials for this Owner
Home Financials are based on the most recent Mortgage that was taken out on this home.
Original Mortgage
$57,510
Interest Rate
4.16%
Mortgage Type
Commercial
Purchase Details
Closed on
Oct 7, 2010
Sold by
Bear Stearns Al Trust 2005-7
Bought by
Collett Shanna D
Purchase Details
Closed on
Jul 6, 2010
Sold by
Brown Jason
Bought by
Bear Stearns Alt-A Trust 2005-
Purchase Details
Closed on
Jan 21, 2005
Sold by
Morris Jerry W and Morris Eleanor
Bought by
Brown Jason
Home Financials for this Owner
Home Financials are based on the most recent Mortgage that was taken out on this home.
Original Mortgage
$76,500
Interest Rate
5.61%
Mortgage Type
New Conventional
Create a Home Valuation Report for This Property
The Home Valuation Report is an in-depth analysis detailing your home's value as well as a comparison with similar homes in the area
Home Values in the Area
Average Home Value in this Area
Purchase History
| Date | Buyer | Sale Price | Title Company |
|---|---|---|---|
| Kayl Holdings Llc | -- | -- | |
| Urban Property Solutions Llc | $22,000 | -- | |
| Collett Shanna D | $17,000 | -- | |
| Bear Stearns Alt-A Trust 2005- | $44,625 | -- | |
| Brown Jason | $70,000 | -- |
Source: Public Records
Mortgage History
| Date | Status | Borrower | Loan Amount |
|---|---|---|---|
| Previous Owner | Urban Property Solutions Llc | $57,510 | |
| Previous Owner | Brown Jason | $76,500 |
Source: Public Records
Tax History Compared to Growth
Tax History
| Year | Tax Paid | Tax Assessment Tax Assessment Total Assessment is a certain percentage of the fair market value that is determined by local assessors to be the total taxable value of land and additions on the property. | Land | Improvement |
|---|---|---|---|---|
| 2025 | $2,542 | $64,840 | $12,000 | $52,840 |
| 2024 | $2,542 | $53,080 | $10,000 | $43,080 |
| 2023 | $1,944 | $53,080 | $10,000 | $43,080 |
| 2022 | $1,702 | $54,160 | $10,000 | $44,160 |
| 2021 | $1,628 | $43,920 | $10,000 | $33,920 |
| 2020 | $1,423 | $38,240 | $8,000 | $30,240 |
| 2019 | $1,353 | $35,720 | $8,000 | $27,720 |
| 2018 | $1,303 | $34,600 | $8,000 | $26,600 |
| 2016 | $359 | $8,800 | $2,130 | $6,670 |
| 2015 | $705 | $25,640 | $6,000 | $19,640 |
| 2014 | $643 | $22,960 | $6,000 | $16,960 |
Source: Public Records
Map
Nearby Homes
- 149 Pristine Dr
- 470 Louise Way
- 498 Louise Way
- 149 Elkins Blvd
- 50 Grove Rd
- 4 Skyland Dr W
- 544 Harmony Way
- 878 Jackson St
- 863 Jackson St
- 36 Highpoint Ln
- 117 Elkins Blvd
- 312 Peeksville Rd
- 26 Skyland Dr W
- 0 Rabbit Run Unit 10569153
- 0 Peeksville Rd Unit 20131057
- 217 Paisley Way
- 805 Wetherford Ct
- 733 Jackson St
- Roswell Plan at Peeksville Landing
- Oakland Plan at Peeksville Landing
- 200 Grove Rd
- 216 Grove Rd
- 342 Maddi Grace Ct
- 341 Maddi Grace Ct Unit 15
- 341 Maddi Grace Ct
- 65 Fuller Rd
- 75 Sunshine Cir
- 338 Maddi Grace Ct Unit 13
- 338 Maddi Grace Ct
- 95 Sunshine Cir
- 85 Sunshine Cir
- 334 Maddi Grace Ct Unit 12
- 334 Maddi Grace Ct
- 220 Grove Rd
- 181 Grove Rd
- 0 Sunshine Cir Unit 7310176
- 0 Sunshine Cir Unit 8530966
- 0 Sunshine Cir Unit 8940227
- 0 Sunshine Cir Unit 21 8778901
- 0 Sunshine Cir Unit 21 8737283