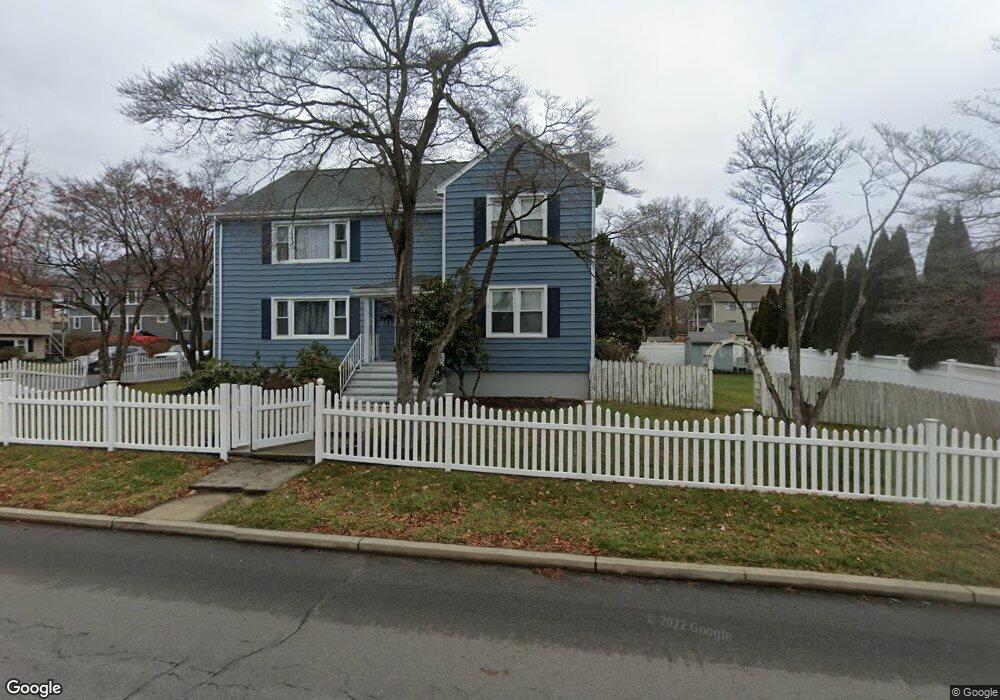
228 Jennings Rd Fairfield, CT 06825
Tunxis Hill NeighborhoodEstimated Value: $507,000 - $1,138,000
3
Beds
3
Baths
1,483
Sq Ft
$620/Sq Ft
Est. Value
About This Home
This home is located at 228 Jennings Rd, Fairfield, CT 06825 and is currently estimated at $919,724, approximately $620 per square foot. 228 Jennings Rd is a home located in Fairfield County with nearby schools including Mckinley Elementary School, Tomlinson Middle School, and Fairfield Warde High School.
Ownership History
Date
Name
Owned For
Owner Type
Purchase Details
Closed on
Jun 4, 2024
Sold by
Scarpetta Michael A and Scarpetta Eleanora
Bought by
Hance Michael R
Current Estimated Value
Home Financials for this Owner
Home Financials are based on the most recent Mortgage that was taken out on this home.
Original Mortgage
$935,750
Outstanding Balance
$924,148
Interest Rate
7.17%
Mortgage Type
Purchase Money Mortgage
Estimated Equity
-$4,424
Purchase Details
Closed on
Aug 3, 2005
Sold by
Calzone Susan F and Calzone Steven T
Bought by
Scarpetta Michael A and Scarpetta Eleanora
Home Financials for this Owner
Home Financials are based on the most recent Mortgage that was taken out on this home.
Original Mortgage
$460,400
Interest Rate
5.63%
Create a Home Valuation Report for This Property
The Home Valuation Report is an in-depth analysis detailing your home's value as well as a comparison with similar homes in the area
Home Values in the Area
Average Home Value in this Area
Purchase History
| Date | Buyer | Sale Price | Title Company |
|---|---|---|---|
| Hance Michael R | $985,000 | None Available | |
| Hance Michael R | $985,000 | None Available | |
| Hance Michael R | $985,000 | None Available | |
| Scarpetta Michael A | $616,000 | -- | |
| Scarpetta Michael A | $616,000 | -- |
Source: Public Records
Mortgage History
| Date | Status | Borrower | Loan Amount |
|---|---|---|---|
| Open | Hance Michael R | $935,750 | |
| Closed | Hance Michael R | $935,750 | |
| Previous Owner | Scarpetta Michael A | $420,880 | |
| Previous Owner | Scarpetta Michael A | $460,400 |
Source: Public Records
Tax History Compared to Growth
Tax History
| Year | Tax Paid | Tax Assessment Tax Assessment Total Assessment is a certain percentage of the fair market value that is determined by local assessors to be the total taxable value of land and additions on the property. | Land | Improvement |
|---|---|---|---|---|
| 2025 | $12,941 | $455,840 | $184,310 | $271,530 |
| 2024 | $12,163 | $435,960 | $184,310 | $251,650 |
| 2023 | $11,993 | $435,960 | $184,310 | $251,650 |
| 2022 | $11,876 | $435,960 | $184,310 | $251,650 |
| 2021 | $11,762 | $435,960 | $184,310 | $251,650 |
| 2020 | $8,850 | $330,330 | $153,650 | $176,680 |
| 2019 | $8,850 | $330,330 | $153,650 | $176,680 |
| 2018 | $8,707 | $330,330 | $153,650 | $176,680 |
| 2017 | $8,529 | $330,330 | $153,650 | $176,680 |
| 2016 | $8,407 | $330,330 | $153,650 | $176,680 |
| 2015 | $7,575 | $305,550 | $154,350 | $151,200 |
| 2014 | $7,455 | $305,550 | $154,350 | $151,200 |
Source: Public Records
Map
Nearby Homes
- 89 Grace St
- 378 Castle Ave
- 145 Brentwood Ave
- 101 Soundview Ave
- 130 Brentwood Ave
- 118 Berwick Ave
- 62 Soundview Ave
- 221 Hunyadi Ave
- 270 Andrassy Ave
- 162 Country Rd Unit 162
- 309 Hunyadi Ave
- 108 Roseville St
- 709 Tunxis Hill Rd
- 25 Country Rd
- 183 Vesper St
- 197 Vesper St
- 155 Moody Ave
- 180 Oakwood Dr
- 274 High St
- 109 Jeniford Rd
- 228 Jennings Rd
- 228 Jennings Rd Unit 2
- 210 Jennings Rd
- 210 Jennings Rd Unit 1
- 20 Prince St
- 212 Jennings Rd
- 237 Jennings Rd
- 11 Prince St
- 258 Jennings Rd
- 229 Jennings Rd
- 229 Jennings Rd Unit 229
- 198 Jennings Rd
- 257 Jennings Rd
- 227 Jennings Rd
- 25 Adelaide St
- 199 Jennings Rd
- 27 Prince St Unit 1
- 27 Prince St
- 27 Prince St
- 27 Prince St Unit 2