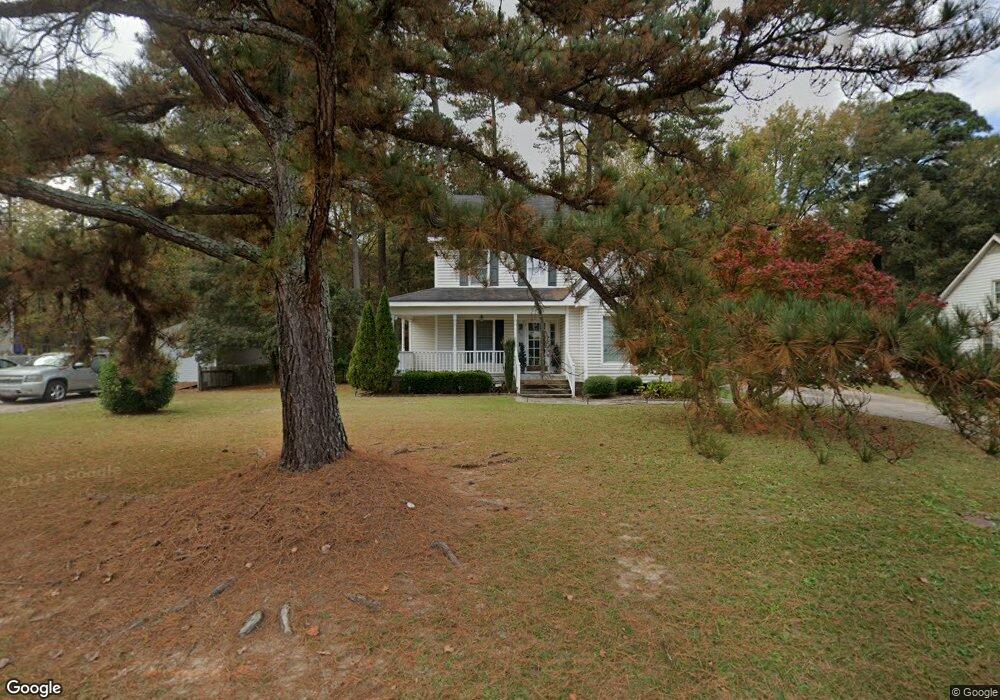
228 Kandemor Ln Rocky Mount, NC 27804
Estimated Value: $230,408 - $277,000
3
Beds
3
Baths
1,749
Sq Ft
$145/Sq Ft
Est. Value
About This Home
This home is located at 228 Kandemor Ln, Rocky Mount, NC 27804 and is currently estimated at $254,102, approximately $145 per square foot. 228 Kandemor Ln is a home located in Nash County with nearby schools including Englewood Elementary School, Rocky Mount Middle School, and G.R. Edwards Middle School.
Ownership History
Date
Name
Owned For
Owner Type
Purchase Details
Closed on
Feb 24, 2010
Sold by
Winterkins Llc
Bought by
Killebrew Sharon D
Current Estimated Value
Home Financials for this Owner
Home Financials are based on the most recent Mortgage that was taken out on this home.
Original Mortgage
$132,554
Outstanding Balance
$89,766
Interest Rate
5.5%
Mortgage Type
FHA
Estimated Equity
$164,336
Purchase Details
Closed on
Aug 28, 2009
Sold by
Secretary Of Veterans Affairs
Bought by
Winterkins Llc
Home Financials for this Owner
Home Financials are based on the most recent Mortgage that was taken out on this home.
Original Mortgage
$97,900
Interest Rate
5.19%
Mortgage Type
Future Advance Clause Open End Mortgage
Purchase Details
Closed on
Nov 12, 2008
Sold by
Lynch Hope M
Bought by
Secretary Of Veterans Affairs
Purchase Details
Closed on
May 1, 2007
Sold by
Williams Sandra and Williams Ray L
Bought by
Stump Rodger D and Stump Donnie S
Create a Home Valuation Report for This Property
The Home Valuation Report is an in-depth analysis detailing your home's value as well as a comparison with similar homes in the area
Home Values in the Area
Average Home Value in this Area
Purchase History
| Date | Buyer | Sale Price | Title Company |
|---|---|---|---|
| Killebrew Sharon D | $135,000 | None Available | |
| Winterkins Llc | -- | None Available | |
| Secretary Of Veterans Affairs | $110,163 | None Available | |
| Stump Rodger D | -- | None Available |
Source: Public Records
Mortgage History
| Date | Status | Borrower | Loan Amount |
|---|---|---|---|
| Open | Killebrew Sharon D | $132,554 | |
| Previous Owner | Winterkins Llc | $97,900 |
Source: Public Records
Tax History Compared to Growth
Tax History
| Year | Tax Paid | Tax Assessment Tax Assessment Total Assessment is a certain percentage of the fair market value that is determined by local assessors to be the total taxable value of land and additions on the property. | Land | Improvement |
|---|---|---|---|---|
| 2025 | $1,312 | $207,890 | $26,850 | $181,040 |
| 2024 | $1,319 | $105,330 | $13,960 | $91,370 |
| 2023 | $716 | $105,330 | $0 | $0 |
| 2022 | $740 | $105,330 | $13,960 | $91,370 |
| 2021 | $716 | $105,330 | $13,960 | $91,370 |
| 2020 | $716 | $105,330 | $13,960 | $91,370 |
| 2019 | $717 | $105,330 | $13,960 | $91,370 |
| 2018 | $716 | $105,330 | $0 | $0 |
| 2017 | $717 | $106,670 | $0 | $0 |
| 2015 | $962 | $143,340 | $0 | $0 |
| 2014 | $841 | $143,340 | $0 | $0 |
Source: Public Records
Map
Nearby Homes
- 117 Tam o Shanter Dr
- 3821 Mansfield Dr
- 3813 Mansfield Dr
- 4001 Lochinvar Ln
- 4228 Belgreen Dr
- 128 Bridgeport Ct
- 3782 Loblolly Dr
- 3782 Loblolly Dr Unit 5
- 213 Braylock Dr
- 3713 Winchester Rd
- 3712 Hawthorne Rd
- 3801 Hawthorne Rd
- 232 Braylock Dr
- 4024 Sunset Ave
- 3617 Woodlawn Rd
- 3617 Hawthorne Rd
- 129 Steeple Chase Rd
- 3545 Chelsea Dr
- 3609 Hawthorne Rd
- 108 Buckingham Ct
- 224 Kandemor Ln
- 232 Kandemor Ln
- 229 Kandemor Ln
- 220 Kandemor Ln
- 233 Kandemor Ln
- 225 Kandemor Ln
- 221 Kandemor Ln
- 4009 Newby Rd
- 4005 Newby Rd
- 216 Kandemor Ln
- 4013 Newby Rd
- 217 Kandemor Ln
- 212 Kandemor Ln
- 213 Kandemor Ln
- 116 Tam o Shanter Dr
- 3833 Mansfield Dr
- 208 Kandemor Ln
- 209 Kandemor Ln
- 3824 Mansfield Dr