Estimated Value: $345,000 - $381,000
3
Beds
3
Baths
2,092
Sq Ft
$172/Sq Ft
Est. Value
About This Home
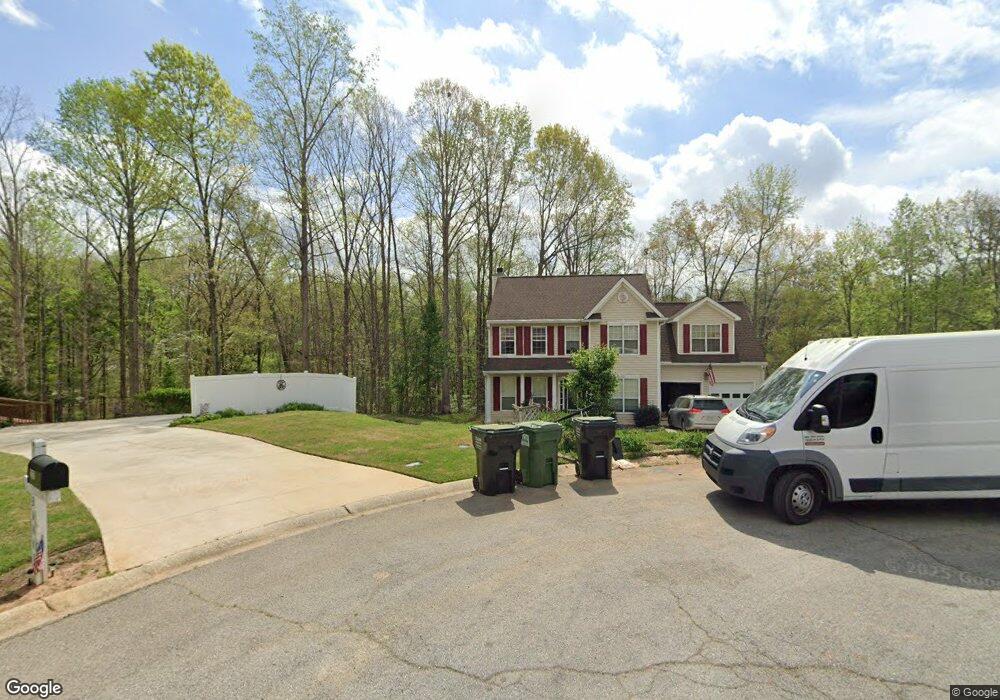
This home is located at 228 Lancaster Way, Hiram, GA 30141 and is currently estimated at $360,421, approximately $172 per square foot. 228 Lancaster Way is a home located in Paulding County with nearby schools including Bessie L. Baggett Elementary School, Irma C. Austin Middle School, and Hiram High School.
Ownership History
Date
Name
Owned For
Owner Type
Purchase Details
Closed on
Nov 15, 2007
Sold by
Hayles Kris E
Bought by
Johnson Curt M and Johnson Susan E
Current Estimated Value
Home Financials for this Owner
Home Financials are based on the most recent Mortgage that was taken out on this home.
Original Mortgage
$167,000
Outstanding Balance
$105,006
Interest Rate
6.26%
Mortgage Type
New Conventional
Estimated Equity
$255,415
Purchase Details
Closed on
Oct 30, 2006
Sold by
Stansel Dennis and Stansel Susan
Bought by
Hayles Kris E
Home Financials for this Owner
Home Financials are based on the most recent Mortgage that was taken out on this home.
Original Mortgage
$159,000
Interest Rate
6.25%
Mortgage Type
New Conventional
Create a Home Valuation Report for This Property
The Home Valuation Report is an in-depth analysis detailing your home's value as well as a comparison with similar homes in the area
Home Values in the Area
Average Home Value in this Area
Purchase History
| Date | Buyer | Sale Price | Title Company |
|---|---|---|---|
| Johnson Curt M | $167,000 | -- | |
| Hayles Kris E | $159,000 | -- |
Source: Public Records
Mortgage History
| Date | Status | Borrower | Loan Amount |
|---|---|---|---|
| Open | Johnson Curt M | $167,000 | |
| Previous Owner | Hayles Kris E | $159,000 |
Source: Public Records
Tax History Compared to Growth
Tax History
| Year | Tax Paid | Tax Assessment Tax Assessment Total Assessment is a certain percentage of the fair market value that is determined by local assessors to be the total taxable value of land and additions on the property. | Land | Improvement |
|---|---|---|---|---|
| 2024 | $3,190 | $131,492 | $12,000 | $119,492 |
| 2023 | $2,958 | $115,972 | $12,000 | $103,972 |
| 2022 | $2,600 | $101,616 | $12,000 | $89,616 |
| 2021 | $2,655 | $93,220 | $8,000 | $85,220 |
| 2020 | $2,114 | $73,016 | $8,000 | $65,016 |
| 2019 | $2,026 | $69,100 | $8,000 | $61,100 |
| 2018 | $1,814 | $62,060 | $8,000 | $54,060 |
| 2017 | $1,766 | $59,660 | $8,000 | $51,660 |
| 2016 | $1,824 | $62,188 | $8,000 | $54,188 |
| 2015 | $1,677 | $56,348 | $8,000 | $48,348 |
| 2014 | $1,239 | $41,100 | $8,000 | $33,100 |
| 2013 | -- | $34,840 | $8,000 | $26,840 |
Source: Public Records
Map
Nearby Homes
- 227 Lancaster Way
- 211 Lancaster Way
- 206 Lancaster Way
- 352 London Ln
- 188 Lancaster Way
- 181 Lancaster Way
- 360 London Ln
- 168 Lancaster Way
- 346 London Ln
- 576 Turnberry Dr
- 602 Turnberry Dr
- 157 Lancaster Way
- 146 Lancaster Way
- 357 London Ln
- 566 Turnberry Dr
- 620 Turnberry Dr
- 343 London Ln
- 135 Lancaster Way
- 118 Lancaster Way
- 280 Buckingham Dr