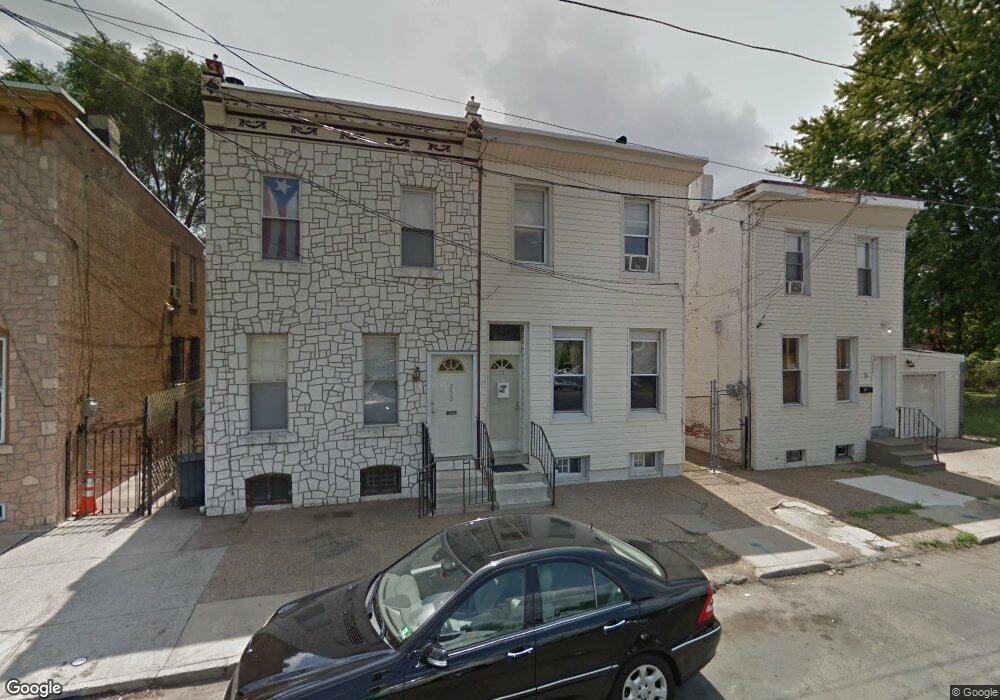
228 Main St Camden, NJ 08102
North Camden NeighborhoodEstimated Value: $151,683 - $211,000
--
Bed
--
Bath
1,472
Sq Ft
$125/Sq Ft
Est. Value
About This Home
This home is located at 228 Main St, Camden, NJ 08102 and is currently estimated at $184,671, approximately $125 per square foot. 228 Main St is a home located in Camden County with nearby schools including Cooper's Poynt Elementary School, Eastside High School, and Camdens Promise Charter School.
Ownership History
Date
Name
Owned For
Owner Type
Purchase Details
Closed on
Oct 3, 1994
Sold by
Gellura Joseph A
Bought by
Rivera Luis
Current Estimated Value
Home Financials for this Owner
Home Financials are based on the most recent Mortgage that was taken out on this home.
Original Mortgage
$25,000
Interest Rate
8.43%
Mortgage Type
FHA
Create a Home Valuation Report for This Property
The Home Valuation Report is an in-depth analysis detailing your home's value as well as a comparison with similar homes in the area
Home Values in the Area
Average Home Value in this Area
Purchase History
| Date | Buyer | Sale Price | Title Company |
|---|---|---|---|
| Rivera Luis | $25,000 | -- |
Source: Public Records
Mortgage History
| Date | Status | Borrower | Loan Amount |
|---|---|---|---|
| Closed | Rivera Luis | $25,000 |
Source: Public Records
Tax History Compared to Growth
Tax History
| Year | Tax Paid | Tax Assessment Tax Assessment Total Assessment is a certain percentage of the fair market value that is determined by local assessors to be the total taxable value of land and additions on the property. | Land | Improvement |
|---|---|---|---|---|
| 2025 | $2,632 | $74,300 | $10,600 | $63,700 |
| 2024 | $2,545 | $74,300 | $10,600 | $63,700 |
| 2023 | $2,545 | $74,300 | $10,600 | $63,700 |
| 2022 | $2,497 | $74,300 | $10,600 | $63,700 |
| 2021 | $2,488 | $74,300 | $10,600 | $63,700 |
| 2020 | $2,363 | $74,300 | $10,600 | $63,700 |
| 2019 | $2,262 | $74,300 | $10,600 | $63,700 |
| 2018 | $2,251 | $74,300 | $10,600 | $63,700 |
| 2017 | $2,196 | $74,300 | $10,600 | $63,700 |
| 2016 | $2,126 | $74,300 | $10,600 | $63,700 |
| 2015 | $2,046 | $74,300 | $10,600 | $63,700 |
| 2014 | $1,997 | $74,300 | $10,600 | $63,700 |
Source: Public Records
Map
Nearby Homes