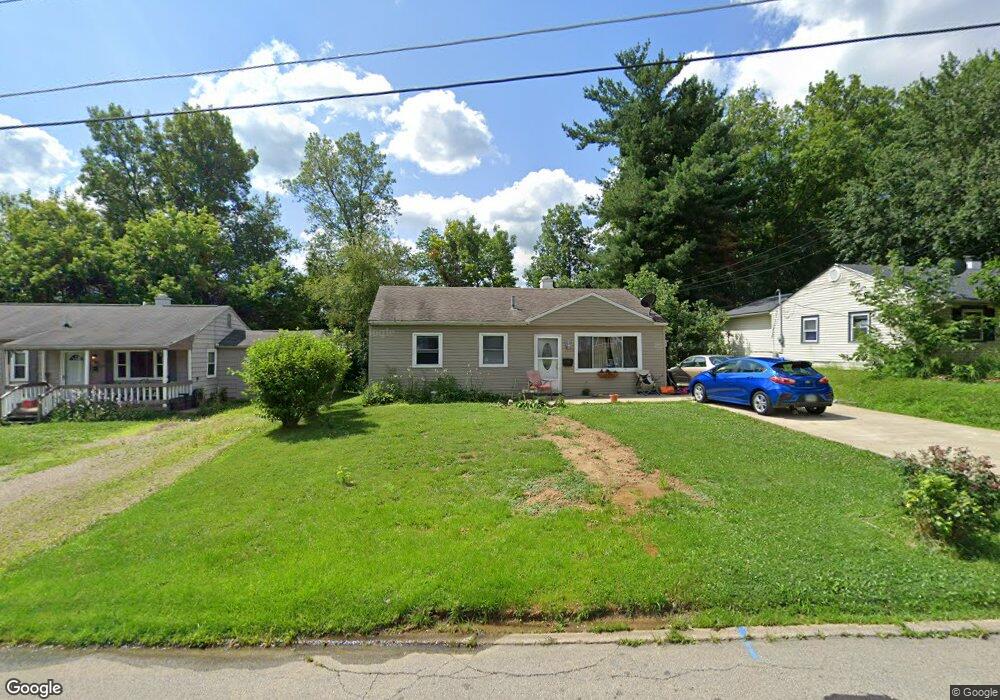
228 Malone Rd Mansfield, OH 44907
Estimated Value: $93,000 - $143,000
3
Beds
1
Bath
875
Sq Ft
$130/Sq Ft
Est. Value
About This Home
This home is located at 228 Malone Rd, Mansfield, OH 44907 and is currently estimated at $113,724, approximately $129 per square foot. 228 Malone Rd is a home located in Richland County with nearby schools including Madison High School, St. Peter's Elementary/Montessori School, and St. Peter's High School/Junior High.
Ownership History
Date
Name
Owned For
Owner Type
Purchase Details
Closed on
Jan 25, 2013
Sold by
Estate Of Conrad A Freeman
Bought by
Freeman Roseann
Current Estimated Value
Purchase Details
Closed on
Oct 2, 2012
Sold by
Transportation Alliance Bank
Bought by
Freeman Conrad A and Freeman Roseann
Purchase Details
Closed on
May 16, 2012
Sold by
Home Solutions Partners Iv Reo Llc
Bought by
Transportation Alliance Bank Inc
Purchase Details
Closed on
Aug 9, 2010
Sold by
Fannie Mae
Bought by
Home Solutions Partners Iv Reo Llc
Purchase Details
Closed on
Apr 27, 2010
Sold by
Day Kevin L
Bought by
Federal National Mortgage Association
Purchase Details
Closed on
Mar 27, 2000
Sold by
Barzanti Beverly M
Bought by
Day Kevin L
Home Financials for this Owner
Home Financials are based on the most recent Mortgage that was taken out on this home.
Original Mortgage
$32,000
Interest Rate
8.43%
Mortgage Type
New Conventional
Create a Home Valuation Report for This Property
The Home Valuation Report is an in-depth analysis detailing your home's value as well as a comparison with similar homes in the area
Home Values in the Area
Average Home Value in this Area
Purchase History
| Date | Buyer | Sale Price | Title Company |
|---|---|---|---|
| Freeman Roseann | -- | None Available | |
| Freeman Conrad A | -- | Attorney | |
| Transportation Alliance Bank Inc | $19,365 | Urban Title | |
| Home Solutions Partners Iv Reo Llc | $10,170 | Attorney | |
| Federal National Mortgage Association | $43,283 | None Available | |
| Day Kevin L | $40,000 | -- |
Source: Public Records
Mortgage History
| Date | Status | Borrower | Loan Amount |
|---|---|---|---|
| Previous Owner | Day Kevin L | $32,000 |
Source: Public Records
Tax History Compared to Growth
Tax History
| Year | Tax Paid | Tax Assessment Tax Assessment Total Assessment is a certain percentage of the fair market value that is determined by local assessors to be the total taxable value of land and additions on the property. | Land | Improvement |
|---|---|---|---|---|
| 2024 | $596 | $23,860 | $5,400 | $18,460 |
| 2023 | $568 | $23,860 | $5,400 | $18,460 |
| 2022 | $309 | $15,820 | $4,490 | $11,330 |
| 2021 | $309 | $15,820 | $4,490 | $11,330 |
| 2020 | $312 | $15,820 | $4,490 | $11,330 |
| 2019 | $233 | $13,510 | $3,810 | $9,700 |
| 2018 | $230 | $13,510 | $3,810 | $9,700 |
| 2017 | $195 | $13,510 | $3,810 | $9,700 |
| 2016 | $213 | $13,140 | $3,620 | $9,520 |
| 2015 | $643 | $13,140 | $3,620 | $9,520 |
| 2014 | $641 | $13,140 | $3,620 | $9,520 |
| 2012 | $633 | $13,830 | $3,810 | $10,020 |
Source: Public Records
Map
Nearby Homes
- 844 Woodville Rd
- 292 Greenlee Rd
- 138 Cliffbrook Dr
- 189 Kinkel Ave
- 607 Woodville Rd
- 33 Rambleside Dr
- 716 Mansfield Washington Rd
- 794 Mansfield Washington Rd
- 405 Plainview Ave
- 61 Ridgewood Blvd
- 1209 Woodville Rd
- 223 Reform St
- 681 Hillgrove Ave
- 490 Rembrandt St
- 674 Hillgrove Ave
- 0 S Main St
- 430 Beethoven St
- 519 S Diamond St
- 220 W Cook Rd
- 136 Elmridge Rd