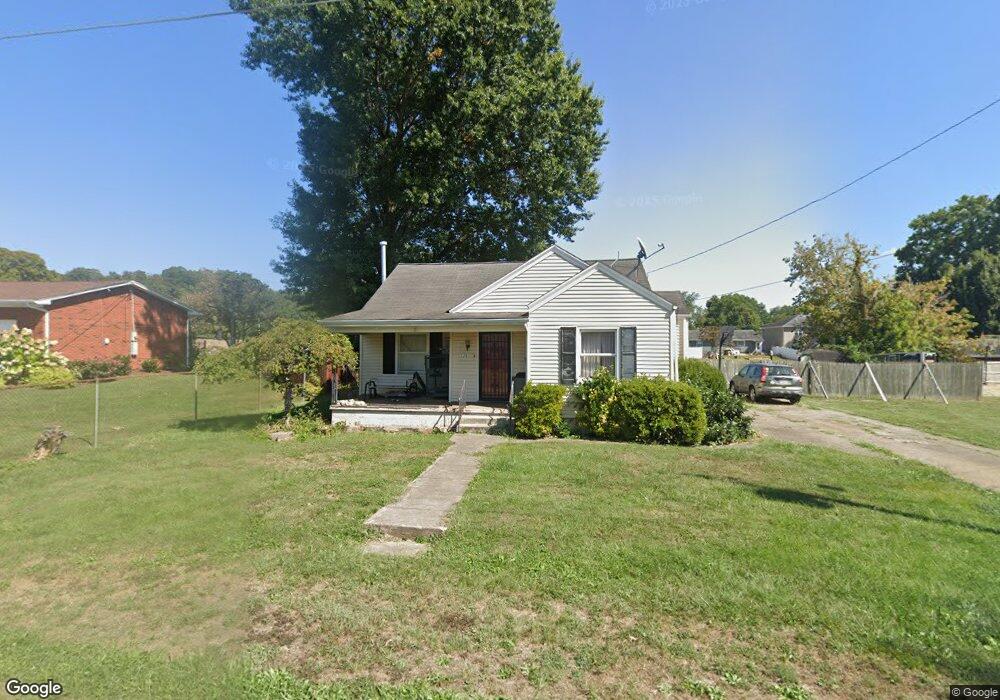
228 Means St Ironton, OH 45638
Estimated Value: $117,000 - $138,000
2
Beds
1
Bath
966
Sq Ft
$135/Sq Ft
Est. Value
About This Home
This home is located at 228 Means St, Ironton, OH 45638 and is currently estimated at $130,221, approximately $134 per square foot. 228 Means St is a home located in Lawrence County with nearby schools including Ironton Elementary School, Ironton Middle School, and Ironton High School.
Ownership History
Date
Name
Owned For
Owner Type
Purchase Details
Closed on
Mar 14, 2012
Sold by
Federal Home Loan Mortgage Corporation
Bought by
Malone Eric
Current Estimated Value
Home Financials for this Owner
Home Financials are based on the most recent Mortgage that was taken out on this home.
Original Mortgage
$50,000
Outstanding Balance
$34,396
Interest Rate
3.9%
Mortgage Type
Purchase Money Mortgage
Estimated Equity
$95,825
Purchase Details
Closed on
Dec 7, 2011
Sold by
Damron Jason L
Bought by
Federal Home Loan Mortgage Corporation
Purchase Details
Closed on
Feb 10, 2006
Sold by
Walters Bryee A and Walters Alicia B
Bought by
Damron Jason L
Home Financials for this Owner
Home Financials are based on the most recent Mortgage that was taken out on this home.
Original Mortgage
$74,000
Interest Rate
6.2%
Mortgage Type
New Conventional
Purchase Details
Closed on
Jan 9, 2001
Sold by
Scherer Susan Elizabeth
Bought by
Walters Bryce A
Create a Home Valuation Report for This Property
The Home Valuation Report is an in-depth analysis detailing your home's value as well as a comparison with similar homes in the area
Home Values in the Area
Average Home Value in this Area
Purchase History
| Date | Buyer | Sale Price | Title Company |
|---|---|---|---|
| Malone Eric | $50,000 | Attorney | |
| Federal Home Loan Mortgage Corporation | $40,000 | Attorney | |
| Damron Jason L | $61,500 | None Available | |
| Walters Bryce A | $60,500 | -- |
Source: Public Records
Mortgage History
| Date | Status | Borrower | Loan Amount |
|---|---|---|---|
| Open | Malone Eric | $50,000 | |
| Previous Owner | Damron Jason L | $74,000 |
Source: Public Records
Tax History Compared to Growth
Tax History
| Year | Tax Paid | Tax Assessment Tax Assessment Total Assessment is a certain percentage of the fair market value that is determined by local assessors to be the total taxable value of land and additions on the property. | Land | Improvement |
|---|---|---|---|---|
| 2024 | -- | $29,150 | $6,420 | $22,730 |
| 2023 | $1,055 | $29,150 | $6,420 | $22,730 |
| 2022 | $1,055 | $29,150 | $6,420 | $22,730 |
| 2021 | $960 | $25,520 | $5,720 | $19,800 |
| 2020 | $976 | $25,520 | $5,720 | $19,800 |
| 2019 | $972 | $25,520 | $5,720 | $19,800 |
| 2018 | $895 | $23,200 | $5,200 | $18,000 |
| 2017 | $893 | $23,200 | $5,200 | $18,000 |
| 2016 | $837 | $23,200 | $5,200 | $18,000 |
| 2015 | $917 | $24,550 | $8,680 | $15,870 |
| 2014 | $885 | $24,550 | $8,680 | $15,870 |
| 2013 | $882 | $24,550 | $8,680 | $15,870 |
Source: Public Records
Map
Nearby Homes