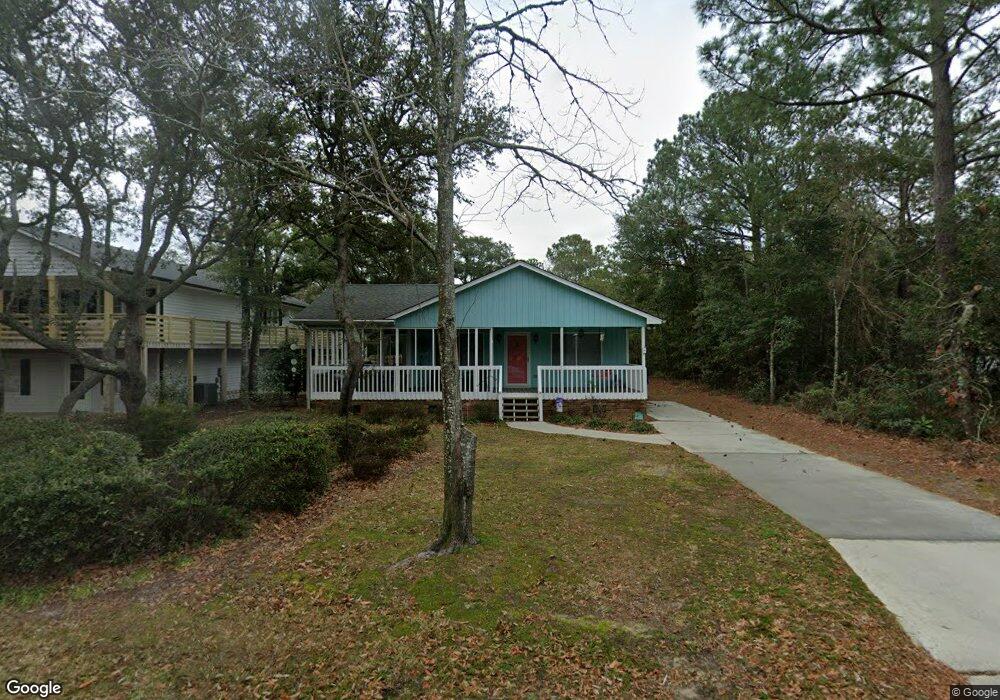
228 NE 45th St Oak Island, NC 28465
Estimated Value: $436,000 - $527,000
3
Beds
2
Baths
1,176
Sq Ft
$401/Sq Ft
Est. Value
About This Home
This home is located at 228 NE 45th St, Oak Island, NC 28465 and is currently estimated at $471,504, approximately $400 per square foot. 228 NE 45th St is a home located in Brunswick County with nearby schools including Southport Elementary School, South Brunswick Middle School, and South Brunswick High School.
Ownership History
Date
Name
Owned For
Owner Type
Purchase Details
Closed on
Feb 28, 2020
Sold by
Economos Sharon Horton and Economos Nickolas Steve
Bought by
Millis Timothy Shane and Millis Meredith K
Current Estimated Value
Home Financials for this Owner
Home Financials are based on the most recent Mortgage that was taken out on this home.
Original Mortgage
$198,000
Outstanding Balance
$175,688
Interest Rate
3.6%
Mortgage Type
New Conventional
Estimated Equity
$295,816
Purchase Details
Closed on
Feb 8, 2018
Sold by
Horton Caroline
Bought by
Economos Sharon Horton
Purchase Details
Closed on
Oct 1, 1988
Bought by
Horton Tommy D
Create a Home Valuation Report for This Property
The Home Valuation Report is an in-depth analysis detailing your home's value as well as a comparison with similar homes in the area
Home Values in the Area
Average Home Value in this Area
Purchase History
| Date | Buyer | Sale Price | Title Company |
|---|---|---|---|
| Millis Timothy Shane | $220,000 | None Available | |
| Economos Sharon Horton | -- | None Available | |
| Horton Tommy D | $8,500 | -- |
Source: Public Records
Mortgage History
| Date | Status | Borrower | Loan Amount |
|---|---|---|---|
| Open | Millis Timothy Shane | $198,000 |
Source: Public Records
Tax History Compared to Growth
Tax History
| Year | Tax Paid | Tax Assessment Tax Assessment Total Assessment is a certain percentage of the fair market value that is determined by local assessors to be the total taxable value of land and additions on the property. | Land | Improvement |
|---|---|---|---|---|
| 2025 | $1,686 | $388,950 | $165,000 | $223,950 |
| 2024 | $1,686 | $388,950 | $165,000 | $223,950 |
| 2023 | $1,095 | $388,950 | $165,000 | $223,950 |
| 2022 | $1,095 | $174,380 | $63,000 | $111,380 |
| 2021 | $1,065 | $174,380 | $63,000 | $111,380 |
| 2020 | $1,040 | $174,380 | $63,000 | $111,380 |
| 2019 | $1,040 | $63,590 | $63,000 | $590 |
| 2018 | $942 | $40,840 | $40,000 | $840 |
| 2017 | $942 | $40,840 | $40,000 | $840 |
| 2016 | $917 | $40,840 | $40,000 | $840 |
| 2015 | $917 | $155,680 | $40,000 | $115,680 |
| 2014 | $776 | $140,046 | $45,000 | $95,046 |
Source: Public Records
Map
Nearby Homes